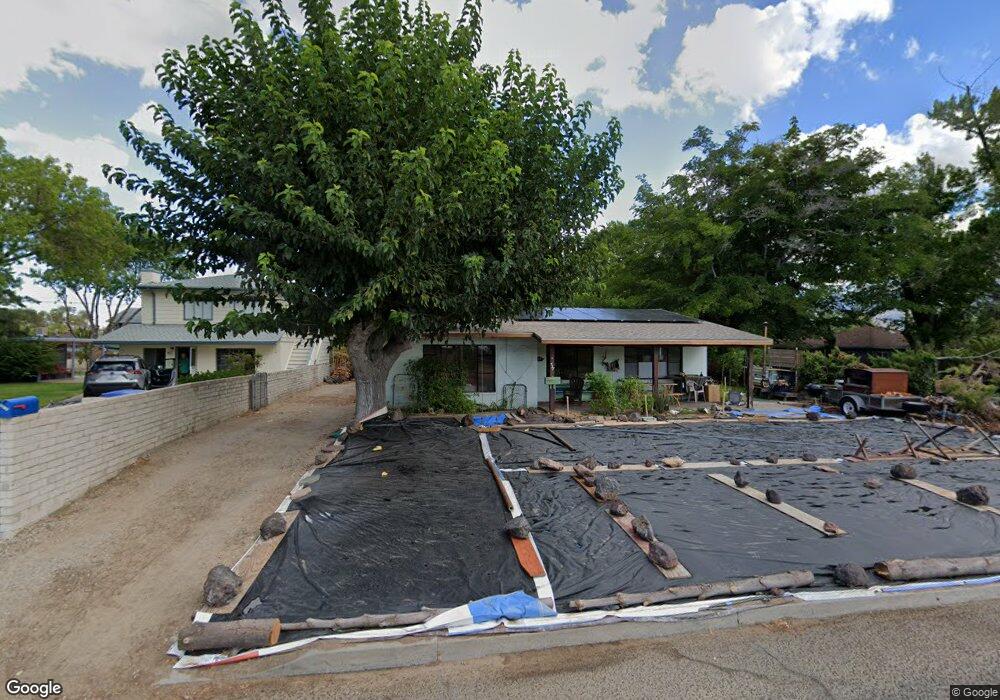
437 E South St Bishop, CA 93514
Estimated Value: $439,000 - $516,000
3
Beds
1
Bath
1,558
Sq Ft
$311/Sq Ft
Est. Value
About This Home
This home is located at 437 E South St, Bishop, CA 93514 and is currently estimated at $484,299, approximately $310 per square foot. 437 E South St is a home located in Inyo County with nearby schools including Bishop Elementary School, Home Street Middle School, and Bishop Union High School.
Ownership History
Date
Name
Owned For
Owner Type
Purchase Details
Closed on
Apr 7, 2023
Sold by
Rowley Anne Louise
Bought by
Palace Flophouse Living Trust
Current Estimated Value
Home Financials for this Owner
Home Financials are based on the most recent Mortgage that was taken out on this home.
Original Mortgage
$405,000
Interest Rate
6.39%
Mortgage Type
New Conventional
Purchase Details
Closed on
May 27, 2011
Sold by
Pister Edwin P and Pister Martha E
Bought by
Pister Karl Philip and Rowley Anne Louise
Create a Home Valuation Report for This Property
The Home Valuation Report is an in-depth analysis detailing your home's value as well as a comparison with similar homes in the area
Home Values in the Area
Average Home Value in this Area
Purchase History
| Date | Buyer | Sale Price | Title Company |
|---|---|---|---|
| Palace Flophouse Living Trust | $450,000 | Inyo-Mono Title | |
| Pister Karl Philip | -- | None Available |
Source: Public Records
Mortgage History
| Date | Status | Borrower | Loan Amount |
|---|---|---|---|
| Previous Owner | Palace Flophouse Living Trust | $405,000 |
Source: Public Records
Tax History
| Year | Tax Paid | Tax Assessment Tax Assessment Total Assessment is a certain percentage of the fair market value that is determined by local assessors to be the total taxable value of land and additions on the property. | Land | Improvement |
|---|---|---|---|---|
| 2025 | $4,885 | $468,180 | $187,272 | $280,908 |
| 2024 | $4,885 | $459,000 | $183,600 | $275,400 |
| 2023 | $791 | $77,587 | $30,148 | $47,439 |
| 2022 | $772 | $76,066 | $29,557 | $46,509 |
| 2021 | $772 | $74,576 | $28,978 | $45,598 |
| 2020 | $744 | $73,812 | $28,681 | $45,131 |
| 2019 | $744 | $72,366 | $28,119 | $44,247 |
| 2018 | $727 | $70,948 | $27,568 | $43,380 |
| 2017 | $711 | $69,558 | $27,028 | $42,530 |
| 2016 | $702 | $68,196 | $26,499 | $41,697 |
| 2015 | $688 | $67,172 | $26,101 | $41,071 |
| 2014 | $673 | $65,857 | $25,590 | $40,267 |
Source: Public Records
Map
Nearby Homes
- 399 E Yaney #53 St
- 399 E Yaney St Unit 53
- 771 N Main St Unit 81
- 852 Crosby St Unit B
- 718 Keough St
- 2278 Sunrise Dr
- 1443 Shelly Creek Rd
- 807 S Barlow Ln
- 2322 Galloway Ave
- 2613 Sierra Vista Way
- 2731 Carol Ln
- 2687 Underwood Ln
- 2360 Brigadoon Ave
- 1519 Glenwood Ln
- 2428 Choctaw Dr
- 235 Wildrose Ln
- 735 Orinda Dr
- 2361 Hopi Cir
- 2250 Cheyenne Dr
- 112 Mclaren Ln
- 459 E South St Unit 23
- 459 E South St
- 431 E South St
- 463 E South St
- 415 E South St
- 475 E South St
- 450 Clarke St
- 436 Clarke St Unit 5
- 436 Clarke St
- 458 Clarke St
- 430 Clarke St
- 481 E South St
- 462 Clarke St
- 424 Clarke St
- 474 Clarke St
- 407 E South St
- 412 Clarke St
- 487 E South St
- 336 S 2nd St
- 480 Clarke St
Your Personal Tour Guide
Ask me questions while you tour the home.