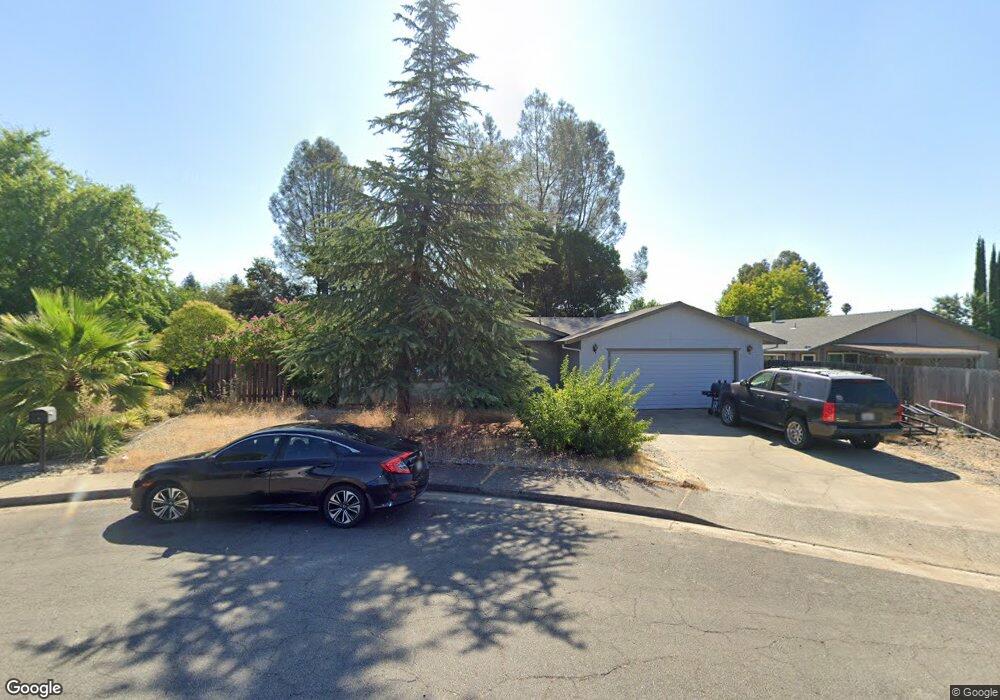
437 Tourmaline Way Redding, CA 96003
Lake Redding NeighborhoodEstimated Value: $335,257 - $406,000
3
Beds
2
Baths
1,300
Sq Ft
$284/Sq Ft
Est. Value
About This Home
This home is located at 437 Tourmaline Way, Redding, CA 96003 and is currently estimated at $368,814, approximately $283 per square foot. 437 Tourmaline Way is a home located in Shasta County with nearby schools including Turtle Bay, Sequoia Middle School, and Shasta High School.
Ownership History
Date
Name
Owned For
Owner Type
Purchase Details
Closed on
Nov 22, 2024
Sold by
Lorenz Franz C
Bought by
Lorenz Franz C and Lorenz Colleen
Current Estimated Value
Create a Home Valuation Report for This Property
The Home Valuation Report is an in-depth analysis detailing your home's value as well as a comparison with similar homes in the area
Home Values in the Area
Average Home Value in this Area
Purchase History
| Date | Buyer | Sale Price | Title Company |
|---|---|---|---|
| Lorenz Franz C | -- | None Listed On Document | |
| Lorenz Franz C | -- | None Listed On Document |
Source: Public Records
Tax History Compared to Growth
Tax History
| Year | Tax Paid | Tax Assessment Tax Assessment Total Assessment is a certain percentage of the fair market value that is determined by local assessors to be the total taxable value of land and additions on the property. | Land | Improvement |
|---|---|---|---|---|
| 2025 | $2,084 | $199,788 | $60,102 | $139,686 |
| 2024 | $2,052 | $195,872 | $58,924 | $136,948 |
| 2023 | $2,052 | $192,032 | $57,769 | $134,263 |
| 2022 | $2,017 | $188,268 | $56,637 | $131,631 |
| 2021 | $2,007 | $184,577 | $55,527 | $129,050 |
| 2020 | $2,033 | $182,685 | $54,958 | $127,727 |
| 2019 | $1,931 | $179,104 | $53,881 | $125,223 |
| 2018 | $1,948 | $175,593 | $52,825 | $122,768 |
| 2017 | $1,937 | $172,151 | $51,790 | $120,361 |
| 2016 | $1,876 | $168,776 | $50,775 | $118,001 |
| 2015 | $1,852 | $166,242 | $50,013 | $116,229 |
Source: Public Records
Map
Nearby Homes
- 2350 Amethyst Way
- 476 Aquamarine Way
- 2520 Snow Ln
- 2872 Harlan Dr
- 418 Moonstone Way
- 490 Turquoise Ct
- 656 West St
- 625 Mary St
- 1840 8th St
- 830 West St
- 1836 Del Mar Ave
- 802 Palatine Ct
- 811 Santa Cruz Dr
- 500-550 Quartz Hill Rd
- 815 Santa Cruz Dr
- 866 Pioneer Dr
- 820 Santa Cruz Dr
- 824 Santa Cruz Dr
- 755 Christine Ave
- 866 Palatine Ct
- 2680 Harlan Dr
- 2620 Harlan Dr
- 488 Tourmaline Way
- 2320 Amethyst Way
- 444 Tourmaline Way
- 408 Tourmaline Way
- 397 Tourmaline Way
- 2661 Snow Ln
- 2689 Snow Ln
- 2400 Amethyst Way
- 2639 Snow Ln
- 2300 Amethyst Way
- 2727 Snow Ln
- 2611 Snow Ln
- 375 Tourmaline Way
- 396 Tourmaline Way
- 2355 Amethyst Way
- 2570 Harlan Dr
- 2755 Snow Ln
- 2448 Amethyst Way