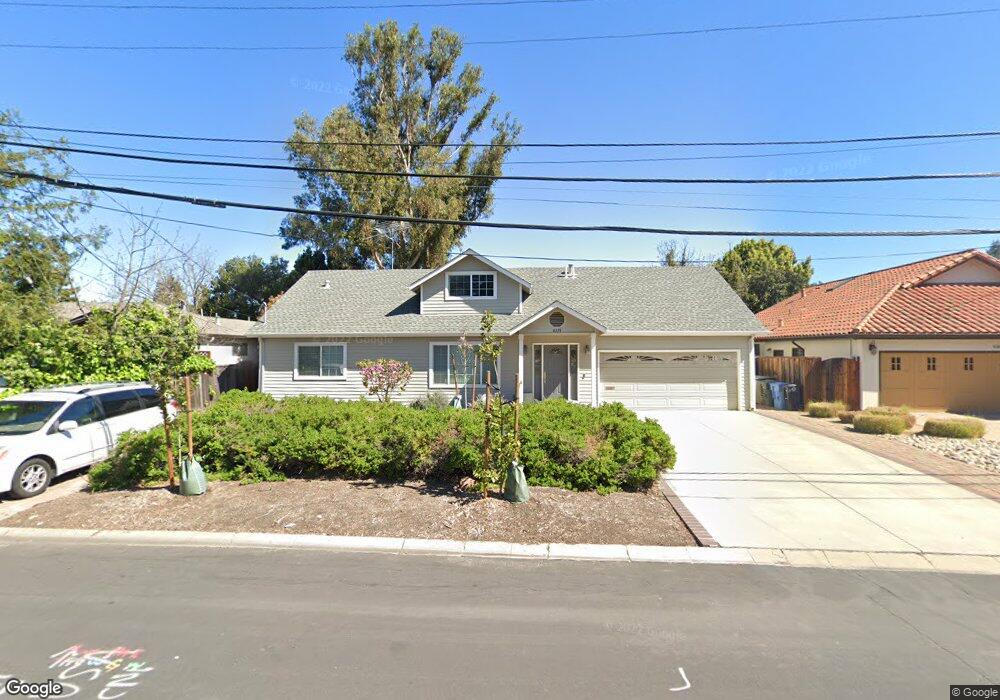
4375 Silva Ave Palo Alto, CA 94306
Mountain View West NeighborhoodEstimated Value: $3,252,000 - $4,527,000
3
Beds
3
Baths
2,553
Sq Ft
$1,561/Sq Ft
Est. Value
About This Home
This home is located at 4375 Silva Ave, Palo Alto, CA 94306 and is currently estimated at $3,984,791, approximately $1,560 per square foot. 4375 Silva Ave is a home located in Santa Clara County with nearby schools including Santa Rita Elementary School, Ardis G. Egan Junior High School, and Los Altos High School.
Ownership History
Date
Name
Owned For
Owner Type
Purchase Details
Closed on
Jul 9, 2025
Sold by
Hong Tammy H
Bought by
Tammy Hong Trust and Hong
Current Estimated Value
Purchase Details
Closed on
Dec 24, 2021
Sold by
Qimera Trust and Hong Jack
Bought by
Alfred Hong And Catherine Chen Trust and Hong
Purchase Details
Closed on
Dec 29, 2020
Sold by
Hong Jack and Huang Mei Erl
Bought by
Hong Tammy H
Purchase Details
Closed on
Jan 31, 2007
Sold by
Hong Jack and Huang Mei Erl
Bought by
Hong Jack and Huang Mei Erl Vicky
Purchase Details
Closed on
Jun 16, 2004
Sold by
Hong Jack and Huang Mei Erl
Bought by
Hong Jack and Huang Mei Erl Vicky
Purchase Details
Closed on
Nov 4, 1999
Sold by
Jack Hong and Alfred Hong
Bought by
Hong Jack and Huang Mei Erl
Home Financials for this Owner
Home Financials are based on the most recent Mortgage that was taken out on this home.
Original Mortgage
$401,200
Interest Rate
4.45%
Create a Home Valuation Report for This Property
The Home Valuation Report is an in-depth analysis detailing your home's value as well as a comparison with similar homes in the area
Home Values in the Area
Average Home Value in this Area
Purchase History
| Date | Buyer | Sale Price | Title Company |
|---|---|---|---|
| Tammy Hong Trust | -- | None Listed On Document | |
| Alfred Hong And Catherine Chen Trust | $1,500,000 | None Listed On Document | |
| Hong Tammy H | $1,450,000 | Chicago Title Company | |
| Hong Jack | -- | None Available | |
| Hong Jack | -- | -- | |
| Hong Jack | $201,000 | Fidelity National Title Co |
Source: Public Records
Mortgage History
| Date | Status | Borrower | Loan Amount |
|---|---|---|---|
| Previous Owner | Hong Jack | $401,200 |
Source: Public Records
Tax History Compared to Growth
Tax History
| Year | Tax Paid | Tax Assessment Tax Assessment Total Assessment is a certain percentage of the fair market value that is determined by local assessors to be the total taxable value of land and additions on the property. | Land | Improvement |
|---|---|---|---|---|
| 2025 | $25,762 | $2,219,559 | $1,547,799 | $671,760 |
| 2024 | $25,762 | $2,176,039 | $1,517,450 | $658,589 |
| 2023 | $25,493 | $2,649,482 | $1,796,170 | $853,312 |
| 2022 | $31,185 | $2,597,532 | $1,760,951 | $836,581 |
| 2021 | $14,713 | $1,152,032 | $511,673 | $640,359 |
| 2020 | $14,830 | $1,140,220 | $506,427 | $633,793 |
| 2019 | $14,143 | $1,117,864 | $496,498 | $621,366 |
| 2018 | $14,005 | $1,095,946 | $486,763 | $609,183 |
| 2017 | $13,494 | $1,074,458 | $477,219 | $597,239 |
| 2016 | $13,175 | $1,053,391 | $467,862 | $585,529 |
| 2015 | $13,003 | $1,037,569 | $460,835 | $576,734 |
| 2014 | $12,872 | $1,017,245 | $451,808 | $565,437 |
Source: Public Records
Map
Nearby Homes
- 181 Del Medio Ave Unit 307
- 278 Monroe Dr Unit 17
- 2255 Showers Dr Unit 111
- 103 Whits Rd
- 4225 Park Blvd
- 4250 El Camino Real Unit B120
- 4206 Rickeys Way Unit C
- 2483 Whitney Dr
- 579 Glenbrook Dr
- 49 Showers Dr Unit J317
- 49 Showers Dr Unit D460
- 49 Showers Dr Unit N364
- 49 Showers Dr Unit E151
- 1023 Mercedes Ave
- 342 Carolina Ln
- 4173 El Camino Real Unit 1
- 3003 Marcelli Cir
- 4148 Byron St
- 37 Los Altos Square
- 2375 Adele Ave
- 4361 Silva Ave
- 4381 Silva Ave
- 4345 Silva Ave
- 260 Del Medio Ave
- 256 Del Medio Ave
- 4392 Silva Ct
- 4394 Silva Ave
- 4337 Silva Ave
- 300 Del Medio Ave
- 4388 Silva Ct
- 250 Del Medio Ave
- 250 Del Medio Ave
- 4344 Silva Ave
- 4329 Silva Ave
- 4384 Silva Ct
- 4348 Silva Ct
- 4338 Silva Ave
- 4319 Silva Ave
- 390 Del Medio Ave
- 4380 Silva Ct