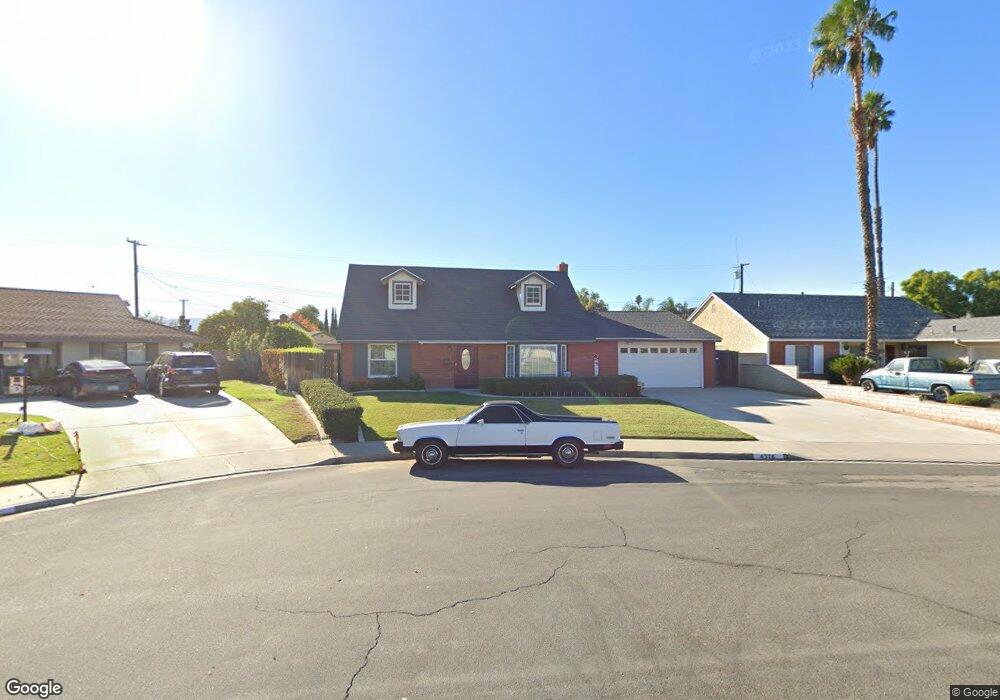
4376 Drury Ct Riverside, CA 92505
La Sierra NeighborhoodEstimated Value: $615,000 - $629,305
4
Beds
3
Baths
1,378
Sq Ft
$451/Sq Ft
Est. Value
About This Home
This home is located at 4376 Drury Ct, Riverside, CA 92505 and is currently estimated at $621,326, approximately $450 per square foot. 4376 Drury Ct is a home located in Riverside County with nearby schools including Collett Elementary School, Arizona Middle School, and La Sierra High School.
Ownership History
Date
Name
Owned For
Owner Type
Purchase Details
Closed on
Dec 7, 2015
Sold by
Neilson Patsy J
Bought by
Dean Patsy Neilson and Family Trust Of Patsy Neilson Dean
Current Estimated Value
Purchase Details
Closed on
Jun 2, 2006
Sold by
Neilson Patsy J
Bought by
Neilson Patsy J and Family Trust Of Patsy J Neilson
Purchase Details
Closed on
Jul 5, 1995
Sold by
Neilson Patsy J
Bought by
Neilson Patsy J and Trust Of Patsy J Neilson
Create a Home Valuation Report for This Property
The Home Valuation Report is an in-depth analysis detailing your home's value as well as a comparison with similar homes in the area
Home Values in the Area
Average Home Value in this Area
Purchase History
| Date | Buyer | Sale Price | Title Company |
|---|---|---|---|
| Dean Patsy Neilson | -- | None Available | |
| Neilson Patsy J | -- | None Available | |
| Neilson Patsy J | -- | -- |
Source: Public Records
Tax History
| Year | Tax Paid | Tax Assessment Tax Assessment Total Assessment is a certain percentage of the fair market value that is determined by local assessors to be the total taxable value of land and additions on the property. | Land | Improvement |
|---|---|---|---|---|
| 2025 | $1,026 | $88,580 | $11,289 | $77,291 |
| 2023 | $1,010 | $85,142 | $10,851 | $74,291 |
| 2022 | $949 | $83,474 | $10,639 | $72,835 |
| 2021 | $947 | $81,838 | $10,431 | $71,407 |
| 2020 | $932 | $81,000 | $10,325 | $70,675 |
| 2019 | $919 | $79,413 | $10,123 | $69,290 |
| 2018 | $906 | $77,857 | $9,925 | $67,932 |
| 2017 | $889 | $76,331 | $9,731 | $66,600 |
| 2016 | $873 | $74,836 | $9,541 | $65,295 |
| 2015 | $859 | $73,714 | $9,399 | $64,315 |
| 2014 | $853 | $72,272 | $9,216 | $63,056 |
Source: Public Records
Map
Nearby Homes
- 4389 Drexel Ave
- 4201 Ferguson Ct
- 4247 Bravado
- 11140 Bridgepoint Ct
- 11141 Gardenhurst Ct
- 10520 Cook Ave
- 11306 Trailstone Ct
- 11230 Reliance Dr
- 11327 Streamhurst Dr
- 4314 Baggett Dr
- 10495 Cook Ave
- 11332 Riverbury Ct
- 4615 Mobley Ave
- 0 Bushnell Ave
- 3874 Polk St Unit F
- 11372 Riverpass Ct
- 10649 Renner St
- 4834 Hedrick Ave
- 11369 Brookglen Ct
- 4878 Streambay Ct
- 4386 Drury Ct
- 4351 Milan Ct
- 4366 Drury Ct
- 4361 Milan Ct
- 4396 Drury Ct
- 4341 Milan Ct
- 4361 Drury Ct
- 4371 Milan Ct
- 4387 Drury Ct
- 4377 Drury Ct
- 4397 Drury Ct
- 10875 Collett Ave
- 4381 Milan Ct
- 10889 Collett Ave
- 10861 Collett Ave
- 10907 Collett Ave
- 4330 Milan Ct
- 10849 Collett Ave
- 10925 Collett Ave
- 4350 Milan Ct
Your Personal Tour Guide
Ask me questions while you tour the home.