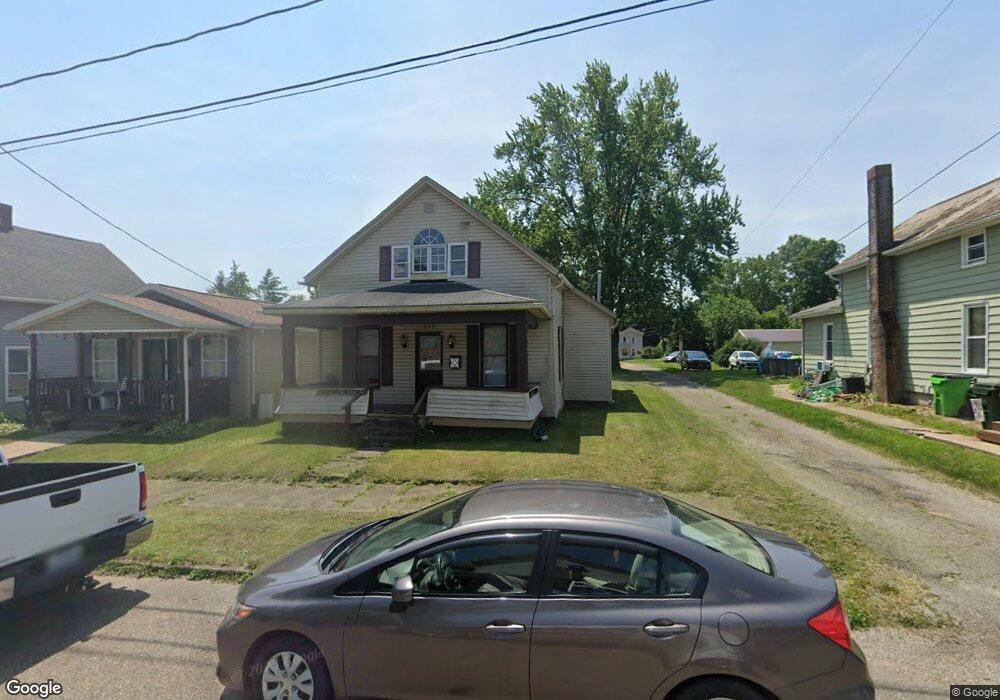
438 E 5th St Uhrichsville, OH 44683
Estimated Value: $87,000 - $106,174
3
Beds
1
Bath
1,232
Sq Ft
$78/Sq Ft
Est. Value
About This Home
This home is located at 438 E 5th St, Uhrichsville, OH 44683 and is currently estimated at $96,294, approximately $78 per square foot. 438 E 5th St is a home located in Tuscarawas County with nearby schools including Claymont High School and Immaculate Conception School.
Ownership History
Date
Name
Owned For
Owner Type
Purchase Details
Closed on
Aug 8, 2008
Sold by
Blue Spruce Entities Llc
Bought by
Lopez Soloman
Current Estimated Value
Purchase Details
Closed on
Apr 24, 2008
Sold by
Seevers Douglas and Seevers Douglas H
Bought by
The Bank Of New York Trust Co Na
Purchase Details
Closed on
Mar 11, 1999
Sold by
Kintz Ronald W and Kintz Jean A
Bought by
Seevers Douglas H and Seevers Shannon J
Home Financials for this Owner
Home Financials are based on the most recent Mortgage that was taken out on this home.
Original Mortgage
$39,468
Interest Rate
6.78%
Mortgage Type
FHA
Purchase Details
Closed on
May 23, 1994
Sold by
Still Milda
Bought by
Kintz Ronald W and Kintz Jean A
Purchase Details
Closed on
Mar 30, 1992
Sold by
Still Milda
Bought by
834 East 5Th Trust
Purchase Details
Closed on
Jun 11, 1987
Bought by
834 East 5Th Trust
Create a Home Valuation Report for This Property
The Home Valuation Report is an in-depth analysis detailing your home's value as well as a comparison with similar homes in the area
Home Values in the Area
Average Home Value in this Area
Purchase History
| Date | Buyer | Sale Price | Title Company |
|---|---|---|---|
| Lopez Soloman | $5,500 | Tusc Title | |
| Blue Spruce Entities Llc | $4,500 | Tusc Title | |
| The Bank Of New York Trust Co Na | $42,400 | Tusc Title | |
| Seevers Douglas H | $39,800 | Colonial Title Agency Inc | |
| Kintz Ronald W | $7,500 | -- | |
| 834 East 5Th Trust | -- | -- | |
| 834 East 5Th Trust | -- | -- |
Source: Public Records
Mortgage History
| Date | Status | Borrower | Loan Amount |
|---|---|---|---|
| Previous Owner | Seevers Douglas H | $39,468 |
Source: Public Records
Tax History Compared to Growth
Tax History
| Year | Tax Paid | Tax Assessment Tax Assessment Total Assessment is a certain percentage of the fair market value that is determined by local assessors to be the total taxable value of land and additions on the property. | Land | Improvement |
|---|---|---|---|---|
| 2024 | $888 | $23,600 | $3,290 | $20,310 |
| 2023 | $888 | $67,450 | $9,410 | $58,040 |
| 2022 | $892 | $23,608 | $3,294 | $20,314 |
| 2021 | $894 | $21,081 | $2,601 | $18,480 |
| 2020 | $911 | $21,081 | $2,601 | $18,480 |
| 2019 | $835 | $21,081 | $2,601 | $18,480 |
| 2018 | $779 | $17,790 | $2,190 | $15,600 |
| 2017 | $780 | $17,790 | $2,190 | $15,600 |
| 2016 | $771 | $17,790 | $2,190 | $15,600 |
| 2014 | $780 | $17,260 | $2,190 | $15,070 |
| 2013 | $786 | $17,260 | $2,190 | $15,070 |
Source: Public Records
Map
Nearby Homes