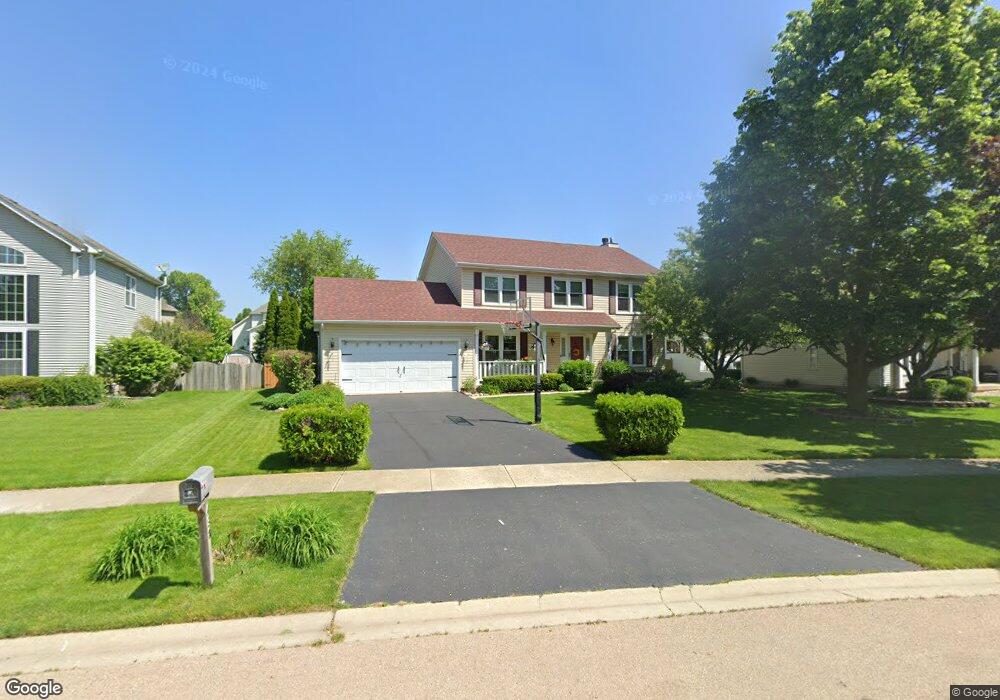
438 Windsor Dr Unit 1 Oswego, IL 60543
South Oswego NeighborhoodEstimated Value: $428,106 - $455,000
4
Beds
3
Baths
2,154
Sq Ft
$203/Sq Ft
Est. Value
About This Home
This home is located at 438 Windsor Dr Unit 1, Oswego, IL 60543 and is currently estimated at $436,777, approximately $202 per square foot. 438 Windsor Dr Unit 1 is a home located in Kendall County with nearby schools including Prairie Point Elementary School, Traughber Junior High School, and Oswego High School.
Ownership History
Date
Name
Owned For
Owner Type
Purchase Details
Closed on
Aug 5, 2021
Sold by
Troscinski David W and Troscinski Marianne D
Bought by
Troscinski David W and Troscinski Marianne D
Current Estimated Value
Purchase Details
Closed on
Aug 2, 2001
Sold by
Schiller Gregory J
Bought by
Troscinski David W and Troscinski Marianne D
Home Financials for this Owner
Home Financials are based on the most recent Mortgage that was taken out on this home.
Original Mortgage
$220,400
Outstanding Balance
$85,229
Interest Rate
7.03%
Estimated Equity
$351,548
Purchase Details
Closed on
May 1, 1996
Bought by
Schiller Gregory J and Schiller Karen S
Purchase Details
Closed on
May 1, 1995
Bought by
Crestview Builders Inc
Create a Home Valuation Report for This Property
The Home Valuation Report is an in-depth analysis detailing your home's value as well as a comparison with similar homes in the area
Home Values in the Area
Average Home Value in this Area
Purchase History
| Date | Buyer | Sale Price | Title Company |
|---|---|---|---|
| Troscinski David W | -- | Attorney | |
| Troscinski David W | $232,000 | -- | |
| Schiller Gregory J | $177,000 | -- | |
| Crestview Builders Inc | $31,000 | -- |
Source: Public Records
Mortgage History
| Date | Status | Borrower | Loan Amount |
|---|---|---|---|
| Open | Troscinski David W | $220,400 | |
| Closed | Crestview Builders Inc | -- |
Source: Public Records
Tax History
| Year | Tax Paid | Tax Assessment Tax Assessment Total Assessment is a certain percentage of the fair market value that is determined by local assessors to be the total taxable value of land and additions on the property. | Land | Improvement |
|---|---|---|---|---|
| 2024 | $9,134 | $119,503 | $28,486 | $91,017 |
| 2023 | $7,690 | $105,755 | $25,209 | $80,546 |
| 2022 | $7,690 | $96,141 | $22,917 | $73,224 |
| 2021 | $7,847 | $89,852 | $21,418 | $68,434 |
| 2020 | $7,758 | $88,090 | $20,998 | $67,092 |
| 2019 | $7,517 | $84,292 | $20,998 | $63,294 |
| 2018 | $4,111 | $85,909 | $18,948 | $66,961 |
| 2017 | $7,617 | $80,288 | $17,708 | $62,580 |
| 2016 | $7,483 | $77,949 | $17,192 | $60,757 |
| 2015 | $3,841 | $76,421 | $16,855 | $59,566 |
| 2014 | -- | $74,195 | $16,364 | $57,831 |
| 2013 | -- | $74,195 | $16,364 | $57,831 |
Source: Public Records
Map
Nearby Homes
- 483 Deerfield Dr
- 482 Deerfield Dr
- 514 Danbury Dr Unit 4
- 668 Cumberland Ln
- 676 Cumberland Ln
- 673 Cumberland Ln
- 851 Claridge Dr
- 770 Dartmouth Ln
- 777 Dartmouth Ln
- 875 Claridge Dr
- 395 Danforth Dr
- 539 Sudbury Cir
- 711 Blossom Ct Unit 2
- 204 Amherst Cir
- 204 Dorset Ave
- 429 Prairieview Dr
- 94 Templeton Dr
- 2253 Barbera Rd
- 2319 Hirsch Dr
- 6115 Rt 34
- 436 Windsor Dr Unit 1
- 440 Windsor Dr
- 329 White Pines Ln
- 331 White Pines Ct
- 442 Windsor Dr
- 434 Windsor Dr
- 437 Windsor Dr
- 333 White Pines Ct
- 443 Windsor Dr
- 444 Windsor Dr
- 431 Windsor Dr
- 432 Windsor Dr
- 445 Windsor Dr
- 335 White Pines Ct
- 335 White Pines Ln
- 325 White Pines Ln
- 430 Windsor Dr
- 103 Bradford Ct
- 320 White Pines Ln
- 447 Windsor Dr
Your Personal Tour Guide
Ask me questions while you tour the home.