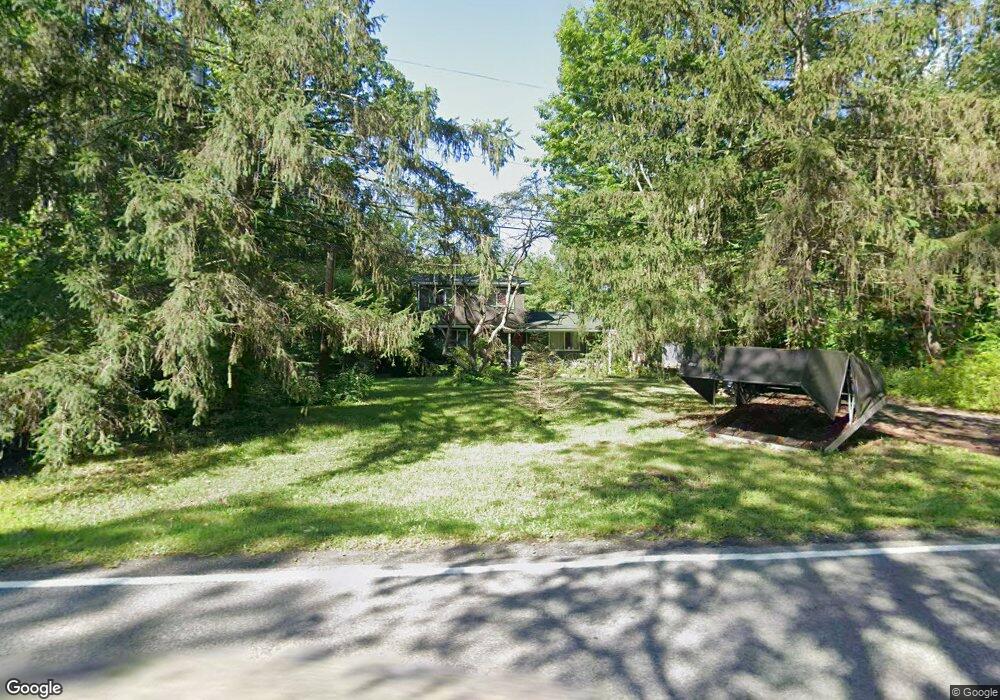
4382 Purdy Rd Lockport, NY 14094
Estimated Value: $218,000 - $303,000
3
Beds
2
Baths
1,400
Sq Ft
$180/Sq Ft
Est. Value
About This Home
This home is located at 4382 Purdy Rd, Lockport, NY 14094 and is currently estimated at $252,404, approximately $180 per square foot. 4382 Purdy Rd is a home located in Niagara County with nearby schools including Aaron Mossell Junior High School, Lockport High School, and DeSales Catholic School.
Ownership History
Date
Name
Owned For
Owner Type
Purchase Details
Closed on
Jan 24, 2023
Sold by
Fonzi Ann M
Bought by
Fonzi Thomas J and Fonzi Ann M
Current Estimated Value
Purchase Details
Closed on
Aug 12, 2010
Sold by
Beaudoin Mark and Beaudoin Julie
Bought by
Fonzi Ann M and Fonzi Thomas J
Home Financials for this Owner
Home Financials are based on the most recent Mortgage that was taken out on this home.
Original Mortgage
$8,000
Interest Rate
6%
Mortgage Type
Seller Take Back
Purchase Details
Closed on
Aug 28, 1997
Sold by
Rosselli Lewis J
Bought by
Schlitzer Ann M
Create a Home Valuation Report for This Property
The Home Valuation Report is an in-depth analysis detailing your home's value as well as a comparison with similar homes in the area
Home Values in the Area
Average Home Value in this Area
Purchase History
| Date | Buyer | Sale Price | Title Company |
|---|---|---|---|
| Fonzi Thomas J | -- | -- | |
| Fonzi Ann M | $15,000 | None Available | |
| Schlitzer Ann M | $79,900 | -- |
Source: Public Records
Mortgage History
| Date | Status | Borrower | Loan Amount |
|---|---|---|---|
| Previous Owner | Fonzi Ann M | $8,000 |
Source: Public Records
Tax History Compared to Growth
Tax History
| Year | Tax Paid | Tax Assessment Tax Assessment Total Assessment is a certain percentage of the fair market value that is determined by local assessors to be the total taxable value of land and additions on the property. | Land | Improvement |
|---|---|---|---|---|
| 2024 | $3,523 | $138,000 | $38,000 | $100,000 |
| 2023 | $1,164 | $125,000 | $31,700 | $93,300 |
| 2022 | $2,902 | $96,000 | $22,800 | $73,200 |
| 2021 | $3,276 | $93,700 | $15,400 | $78,300 |
| 2020 | $2,446 | $93,700 | $15,400 | $78,300 |
| 2019 | $1,472 | $91,000 | $15,400 | $75,600 |
| 2018 | $2,607 | $91,000 | $15,400 | $75,600 |
| 2017 | $2,451 | $86,500 | $15,400 | $71,100 |
| 2016 | $2,475 | $86,500 | $15,400 | $71,100 |
| 2015 | -- | $84,000 | $15,400 | $68,600 |
| 2014 | -- | $84,000 | $15,400 | $68,600 |
Source: Public Records
Map
Nearby Homes