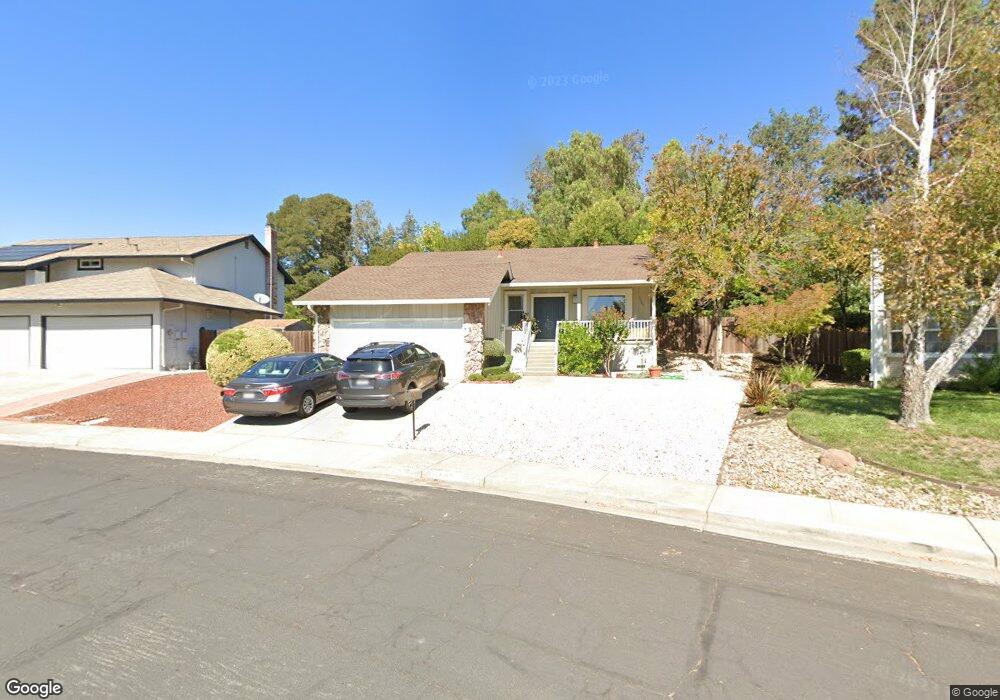
4383 Fallbrook Rd Concord, CA 94521
Midtown Concord NeighborhoodEstimated Value: $796,000 - $882,000
3
Beds
2
Baths
1,588
Sq Ft
$531/Sq Ft
Est. Value
About This Home
This home is located at 4383 Fallbrook Rd, Concord, CA 94521 and is currently estimated at $842,564, approximately $530 per square foot. 4383 Fallbrook Rd is a home located in Contra Costa County with nearby schools including Mountain View Elementary School, El Dorado Middle School, and Concord High School.
Ownership History
Date
Name
Owned For
Owner Type
Purchase Details
Closed on
Dec 20, 2016
Sold by
Polcin Douglas and Guterman Christine
Bought by
Livi Christine and Livi Douglas
Current Estimated Value
Purchase Details
Closed on
Sep 25, 2000
Sold by
Cerf Alan R and Cerf Lila
Bought by
Polcin Douglas and Guterman Christine
Home Financials for this Owner
Home Financials are based on the most recent Mortgage that was taken out on this home.
Original Mortgage
$272,000
Interest Rate
7.98%
Mortgage Type
Purchase Money Mortgage
Purchase Details
Closed on
Sep 23, 1999
Sold by
Cerf Alan R and Cerf Lila
Bought by
Cerf Alan R and Cerf Lila S
Create a Home Valuation Report for This Property
The Home Valuation Report is an in-depth analysis detailing your home's value as well as a comparison with similar homes in the area
Home Values in the Area
Average Home Value in this Area
Purchase History
| Date | Buyer | Sale Price | Title Company |
|---|---|---|---|
| Livi Christine | -- | None Available | |
| Polcin Douglas | $340,000 | Commonwealth Land Title Co | |
| Cerf Alan R | -- | -- |
Source: Public Records
Mortgage History
| Date | Status | Borrower | Loan Amount |
|---|---|---|---|
| Previous Owner | Polcin Douglas | $272,000 | |
| Closed | Polcin Douglas | $51,000 |
Source: Public Records
Tax History
| Year | Tax Paid | Tax Assessment Tax Assessment Total Assessment is a certain percentage of the fair market value that is determined by local assessors to be the total taxable value of land and additions on the property. | Land | Improvement |
|---|---|---|---|---|
| 2025 | $6,587 | $512,303 | $202,505 | $309,798 |
| 2024 | $6,285 | $502,259 | $198,535 | $303,724 |
| 2023 | $6,285 | $492,412 | $194,643 | $297,769 |
| 2022 | $6,194 | $482,758 | $190,827 | $291,931 |
| 2021 | $6,037 | $473,293 | $187,086 | $286,207 |
| 2019 | $5,916 | $459,257 | $181,538 | $277,719 |
| 2018 | $5,688 | $450,253 | $177,979 | $272,274 |
| 2017 | $5,494 | $441,426 | $174,490 | $266,936 |
| 2016 | $5,336 | $432,771 | $171,069 | $261,702 |
| 2015 | $5,269 | $426,271 | $168,500 | $257,771 |
| 2014 | $5,172 | $417,922 | $165,200 | $252,722 |
Source: Public Records
Map
Nearby Homes
- 1450 Bel Air Dr Unit 110
- 1430 Bel Air Dr Unit 305
- 1430 Bel Air Dr Unit 103
- 4632 Melody Dr Unit E
- 4225 Sherwood Ct
- 1515 Thornwood Dr
- 4185 Huckleberry Dr
- 1548 Dianda Dr
- 4273 Armand Dr
- 1358 Swallowtail Rd
- 1544 Bailey Rd Unit 39
- 1544 Bailey Rd Unit 3
- 4317 Cowell Rd
- 1200 Stonecrest Ln
- 4020 Joan Ave
- 1475 Bassett Dr
- 1662 Glazier Dr
- 4869 Wolf Way
- 1511 Parkwood Place
- 4081 Clayton Rd Unit 235
- 4387 Fallbrook Rd
- 4379 Fallbrook Rd
- 1327 Waterfall Way
- 1329 Waterfall Way
- 1325 Waterfall Way
- 1323 Waterfall Way
- 1321 Waterfall Way
- 1333 Waterfall Way
- 4375 Fallbrook Rd
- 1319 Waterfall Way
- 4391 Fallbrook Rd
- 1317 Waterfall Way
- 4371 Fallbrook Rd
- 1315 Waterfall Way
- 1313 Waterfall Way
- 4395 Fallbrook Rd
- 1311 Waterfall Way
- 1328 Saddlehill Ln
- 1326 Saddlehill Ln
- 1330 Saddlehill Ln
Your Personal Tour Guide
Ask me questions while you tour the home.