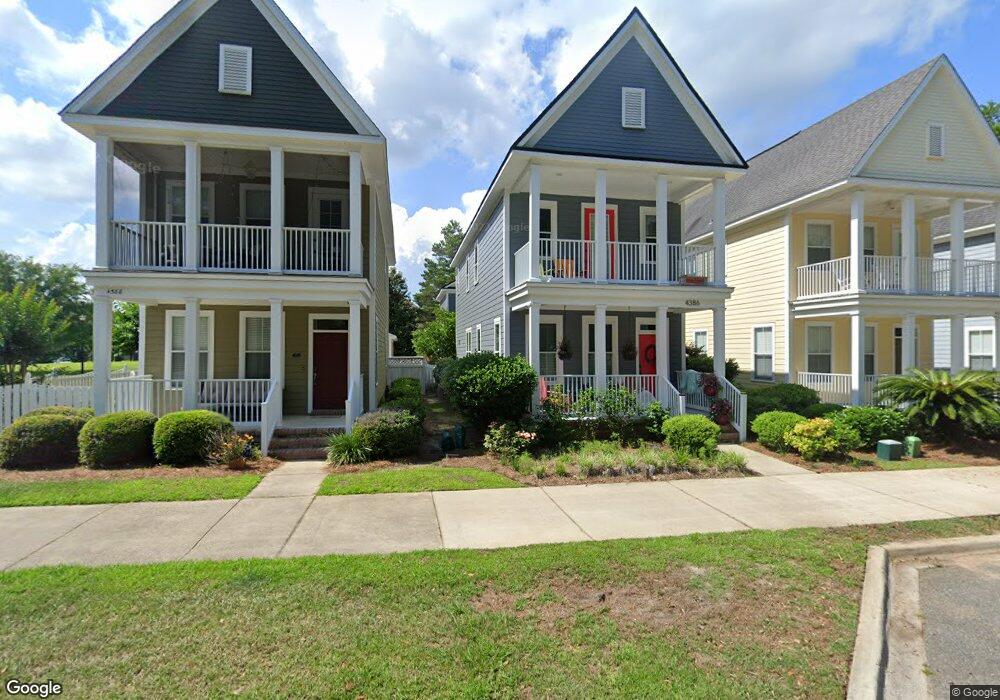
4386 Grove Park Dr Unit 1 Tallahassee, FL 32311
Southwood NeighborhoodEstimated Value: $419,446 - $475,000
3
Beds
3
Baths
1,650
Sq Ft
$273/Sq Ft
Est. Value
About This Home
This home is located at 4386 Grove Park Dr Unit 1, Tallahassee, FL 32311 and is currently estimated at $450,612, approximately $273 per square foot. 4386 Grove Park Dr Unit 1 is a home located in Leon County with nearby schools including J. Michael Conley Elementary School at Southwood, Fairview Middle School, and James Rickards High School.
Ownership History
Date
Name
Owned For
Owner Type
Purchase Details
Closed on
Sep 6, 2016
Sold by
Rice Peter W and Rice Melanie
Bought by
Wyman Ii Mathew G and Wyman Tia M
Current Estimated Value
Home Financials for this Owner
Home Financials are based on the most recent Mortgage that was taken out on this home.
Original Mortgage
$269,000
Outstanding Balance
$215,005
Interest Rate
3.45%
Mortgage Type
VA
Estimated Equity
$235,607
Purchase Details
Closed on
Dec 6, 2012
Sold by
Kuersteiner Richard L and Kuersteiner Barbara L
Bought by
Rice Peter W and Rice Melanie
Purchase Details
Closed on
Sep 2, 2005
Sold by
St Joe Home Building Lp
Bought by
Kuersteiner Richard L and Kuersteiner Barbara L
Home Financials for this Owner
Home Financials are based on the most recent Mortgage that was taken out on this home.
Original Mortgage
$213,228
Interest Rate
7.12%
Mortgage Type
Fannie Mae Freddie Mac
Create a Home Valuation Report for This Property
The Home Valuation Report is an in-depth analysis detailing your home's value as well as a comparison with similar homes in the area
Home Values in the Area
Average Home Value in this Area
Purchase History
| Date | Buyer | Sale Price | Title Company |
|---|---|---|---|
| Wyman Ii Mathew G | $269,000 | Hayward Title Group | |
| Rice Peter W | $239,000 | Owen Title Company Inc | |
| Kuersteiner Richard L | $266,600 | Residential Cmnty Title Co |
Source: Public Records
Mortgage History
| Date | Status | Borrower | Loan Amount |
|---|---|---|---|
| Open | Wyman Ii Mathew G | $269,000 | |
| Previous Owner | Kuersteiner Richard L | $213,228 |
Source: Public Records
Tax History Compared to Growth
Tax History
| Year | Tax Paid | Tax Assessment Tax Assessment Total Assessment is a certain percentage of the fair market value that is determined by local assessors to be the total taxable value of land and additions on the property. | Land | Improvement |
|---|---|---|---|---|
| 2024 | $6,960 | $332,701 | $60,000 | $272,701 |
| 2023 | $4,808 | $267,480 | $0 | $0 |
| 2022 | $4,532 | $259,689 | $0 | $0 |
| 2021 | $4,469 | $252,125 | $0 | $0 |
| 2020 | $4,373 | $248,644 | $45,000 | $203,644 |
| 2019 | $4,336 | $244,329 | $45,000 | $199,329 |
| 2018 | $4,355 | $247,111 | $0 | $0 |
| 2017 | $4,378 | $242,028 | $0 | $0 |
| 2016 | $3,919 | $205,891 | $0 | $0 |
| 2015 | $3,806 | $204,460 | $0 | $0 |
| 2014 | $3,806 | $202,837 | $0 | $0 |
Source: Public Records
Map
Nearby Homes
- 4075 Colleton Ct
- 4069 Colleton Ct
- 4064 Colleton Ct
- 4063 Four Oaks Blvd
- 4059 Four Oaks Blvd
- 4057 Four Oaks Blvd
- 3085 Merchants Row Blvd
- 3756 Grove Park Dr
- 4640 Grove Park Dr
- 2128 Drayton Dr
- 3258 Appleton Dr
- 4061 Shady View Ln
- 1957 Tree Swallow Dr
- 4069 Brownstone Way
- 1953 Tree Swallow Dr
- 4057 Brownstone Way
- 4053 Brownstone Way
- 4049 Brownstone Way
- 4045 Brownstone Way
- 1949 Tree Swallow Dr
- 4386 Grove Park Dr Unit 14
- 4386 Grove Park Dr
- 4382 Grove Park Dr
- 4388 Grove Park Dr Unit 14
- 4378 Grove Park Dr Unit 14
- 4378 Grove Park Dr
- 4374 Grove Park Dr Unit 14
- 4374 Grove Park Dr
- 4266 Park Crossing Tr
- 4266 Park Crossing Tr Unit 1
- 4266 Park Crossing Trail Unit 14
- 4266 Park Crossing Trail Unit Carriage Home
- 4266 Park Crossing Trail
- 4270 Park Crossing Trail Unit 14
- 4270 Park Crossing Trail
- 4274 Park Crossing Trail
- 4274 Park Crossing Trail Unit 22
- 4362 Grove Park Dr
- 4278 Park Crossing Trail Unit 14
- 4278 Park Crossing Trail