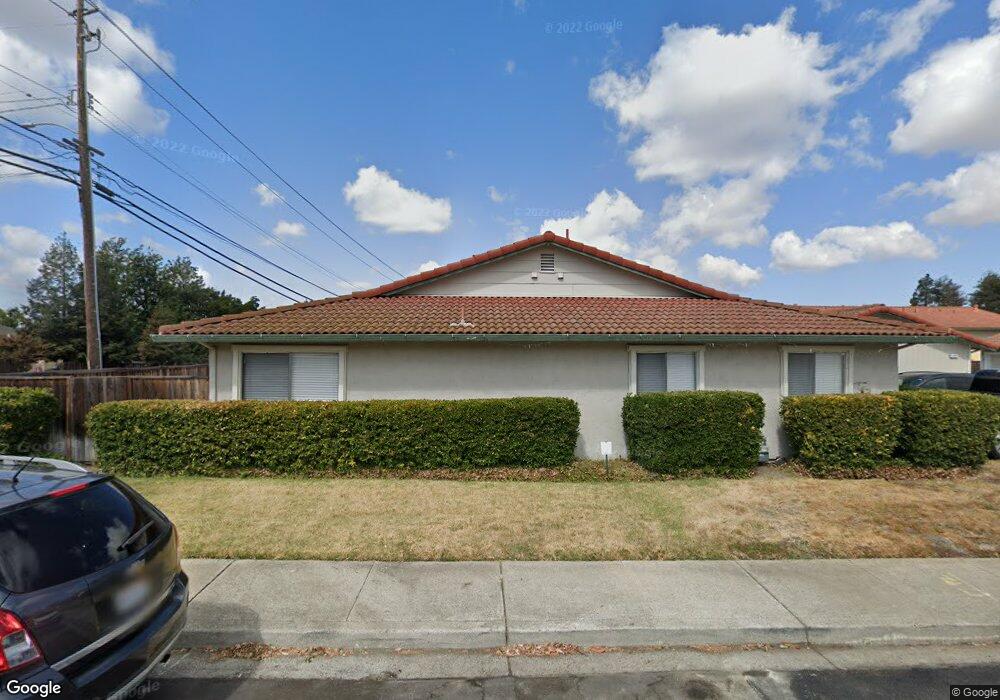
4388 Saint Charles Place Concord, CA 94521
Midtown Concord NeighborhoodEstimated Value: $490,959 - $537,000
3
Beds
2
Baths
1,182
Sq Ft
$430/Sq Ft
Est. Value
About This Home
This home is located at 4388 Saint Charles Place, Concord, CA 94521 and is currently estimated at $508,740, approximately $430 per square foot. 4388 Saint Charles Place is a home located in Contra Costa County with nearby schools including Woodside Elementary School, Oak Grove Middle School, and Ygnacio Valley High School.
Ownership History
Date
Name
Owned For
Owner Type
Purchase Details
Closed on
Nov 10, 2020
Sold by
Tricon Sfr 2020 2 Borrower Llc
Bought by
Tricon Sfr 2020 2 Borrower Llc
Current Estimated Value
Purchase Details
Closed on
Oct 25, 2016
Sold by
Mckinley Holding I Lp
Bought by
Tah 2016-1 Borrower Llc
Purchase Details
Closed on
Jan 28, 2013
Sold by
Meadow Creek Group Llc
Bought by
Mckinley Holding I Lp
Purchase Details
Closed on
May 21, 2009
Sold by
Heaton Doyle D
Bought by
Meadow Creek Group Llc
Purchase Details
Closed on
Dec 23, 2004
Sold by
Heaton Mary K
Bought by
Heaton Doyle D
Create a Home Valuation Report for This Property
The Home Valuation Report is an in-depth analysis detailing your home's value as well as a comparison with similar homes in the area
Home Values in the Area
Average Home Value in this Area
Purchase History
| Date | Buyer | Sale Price | Title Company |
|---|---|---|---|
| Tricon Sfr 2020 2 Borrower Llc | -- | Os National Llc | |
| Tah 2016-1 Borrower Llc | -- | Fidelity National Title Grou | |
| Mckinley Holding I Lp | $179,500 | First American Title Company | |
| Meadow Creek Group Llc | $416,667 | Old Republic Title Company | |
| Heaton Doyle D | -- | Financial Title |
Source: Public Records
Tax History Compared to Growth
Tax History
| Year | Tax Paid | Tax Assessment Tax Assessment Total Assessment is a certain percentage of the fair market value that is determined by local assessors to be the total taxable value of land and additions on the property. | Land | Improvement |
|---|---|---|---|---|
| 2025 | $3,862 | $270,902 | $80,037 | $190,865 |
| 2024 | $3,862 | $265,591 | $78,468 | $187,123 |
| 2023 | $3,773 | $260,384 | $76,930 | $183,454 |
| 2022 | $3,705 | $255,279 | $75,422 | $179,857 |
| 2021 | $3,600 | $250,275 | $73,944 | $176,331 |
| 2019 | $3,521 | $242,852 | $71,751 | $171,101 |
| 2018 | $3,378 | $238,092 | $70,345 | $167,747 |
| 2017 | $3,254 | $233,424 | $68,966 | $164,458 |
| 2016 | $3,144 | $228,848 | $67,614 | $161,234 |
| 2015 | $3,085 | $225,412 | $66,599 | $158,813 |
| 2014 | $3,011 | $220,998 | $65,295 | $155,703 |
Source: Public Records
Map
Nearby Homes
- 4380 Saint Charles Place
- 4317 Cowell Rd
- 1158 Saint Matthew Place Unit 107
- 4362 Lynn Dr
- 1274 Stephanie Ct
- 1187 Kaski Ln
- 1167 Kaski Ln
- 1318 Perth Ct
- 4065 Cowell Rd
- 4516 Spring Valley Way
- 4058 Treat Blvd
- 4321 Kingswood Dr
- 4112 Kensington Ct
- 4513 Birch Bark Rd
- 4129 Kensington Dr
- 4055 Kimberly Place
- 1170 Green Gables Ct
- 1051 Tilley Cir
- 1364 Cobblestone Ct
- 1381 Rosal Ln
- 4390 Saint Charles Place
- 4336 Saint Charles Place
- 4338 Saint Charles Place
- 4342 Saint Charles Place
- 4344 Saint Charles Place
- 4346 Saint Charles Place
- 4384 Saint Charles Place
- 4350 Saint Charles Place
- 4391 Saint Charles Place
- 4395 Saint Charles Place
- 4385 Saint Charles Place
- 400 Cowell Rd
- 4334 Saint Charles Place
- 4332 Saint Charles Place
- 4381 Saint Charles Place
- 4328 Saint Charles Place
- 4330 Saint Charles Place
- 4326 Saint Charles Place
- 4375 Saint Charles Place
- 4324 Saint Charles Place