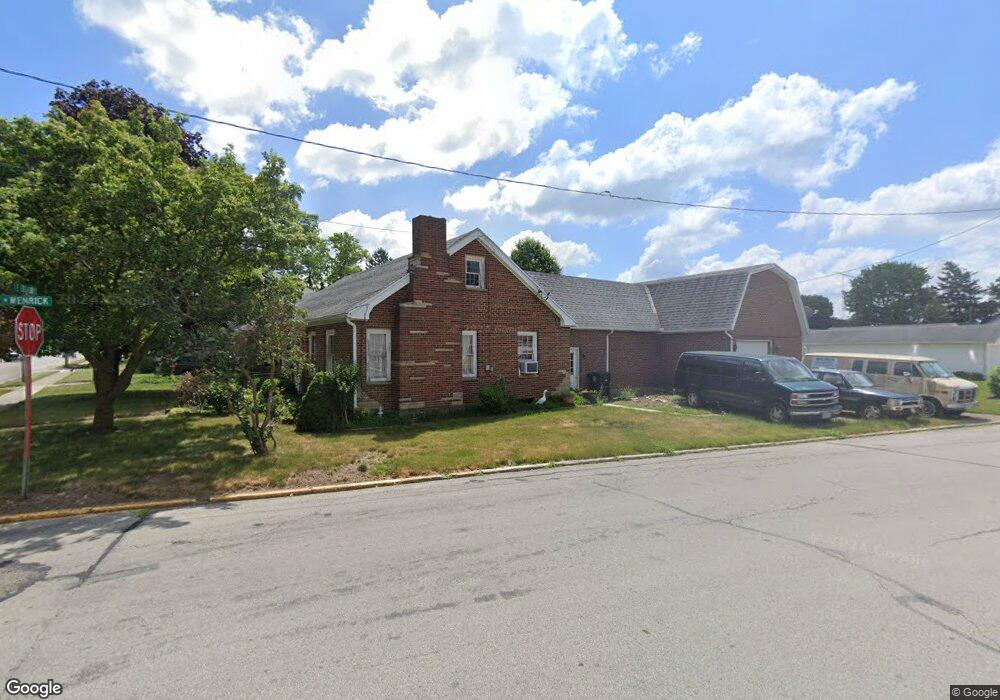
439 E Broadway St Covington, OH 45318
Estimated Value: $178,480 - $230,000
2
Beds
2
Baths
1,408
Sq Ft
$147/Sq Ft
Est. Value
About This Home
This home is located at 439 E Broadway St, Covington, OH 45318 and is currently estimated at $206,370, approximately $146 per square foot. 439 E Broadway St is a home located in Miami County with nearby schools including Covington Elementary/Junior High School, Covington Junior High School, and Covington High School.
Ownership History
Date
Name
Owned For
Owner Type
Purchase Details
Closed on
Oct 26, 2021
Sold by
Colby Roger W
Bought by
Colby Roger W
Current Estimated Value
Purchase Details
Closed on
Oct 19, 2021
Sold by
Colby Roger W
Bought by
Colby Roger W
Purchase Details
Closed on
Nov 1, 1978
Bought by
Colby Roger W
Create a Home Valuation Report for This Property
The Home Valuation Report is an in-depth analysis detailing your home's value as well as a comparison with similar homes in the area
Home Values in the Area
Average Home Value in this Area
Purchase History
| Date | Buyer | Sale Price | Title Company |
|---|---|---|---|
| Colby Roger W | -- | -- | |
| Colby Roger W | -- | None Available | |
| Colby Roger W | -- | -- |
Source: Public Records
Tax History
| Year | Tax Paid | Tax Assessment Tax Assessment Total Assessment is a certain percentage of the fair market value that is determined by local assessors to be the total taxable value of land and additions on the property. | Land | Improvement |
|---|---|---|---|---|
| 2025 | $1,936 | $79,240 | $3,220 | $76,020 |
| 2024 | $1,936 | $53,410 | $3,500 | $49,910 |
| 2023 | $1,641 | $53,410 | $3,500 | $49,910 |
| 2022 | $1,675 | $53,410 | $3,500 | $49,910 |
| 2021 | $1,313 | $41,100 | $2,700 | $38,400 |
| 2020 | $1,316 | $41,100 | $2,700 | $38,400 |
| 2019 | $1,322 | $41,100 | $2,700 | $38,400 |
| 2018 | $1,215 | $38,400 | $2,070 | $36,330 |
| 2017 | $1,237 | $38,400 | $2,070 | $36,330 |
| 2016 | $1,221 | $38,400 | $2,070 | $36,330 |
| 2015 | $1,114 | $36,930 | $2,000 | $34,930 |
| 2014 | $1,114 | $36,930 | $2,000 | $34,930 |
| 2013 | $1,073 | $36,930 | $2,000 | $34,930 |
Source: Public Records
Map
Nearby Homes
- 415 E Broadway St
- 309 Ullery Dr
- 409 E Broadway St
- 308 N Wenrick St
- 307 N Wenrick St
- 418 E Broadway St
- 307 Ullery Dr
- 440 E Broadway St
- 501 E Broadway St
- 414 E Broadway St
- 306 N Wenrick St
- 446 E Broadway St
- 305 N Wenrick St
- 401 E Broadway St
- 305 Ullery Dr
- 308 N Ludlow St
- 408 E Broadway St
- 505 E Broadway St
- 505 E Broadway St
- 308 Ullery Dr
Your Personal Tour Guide
Ask me questions while you tour the home.