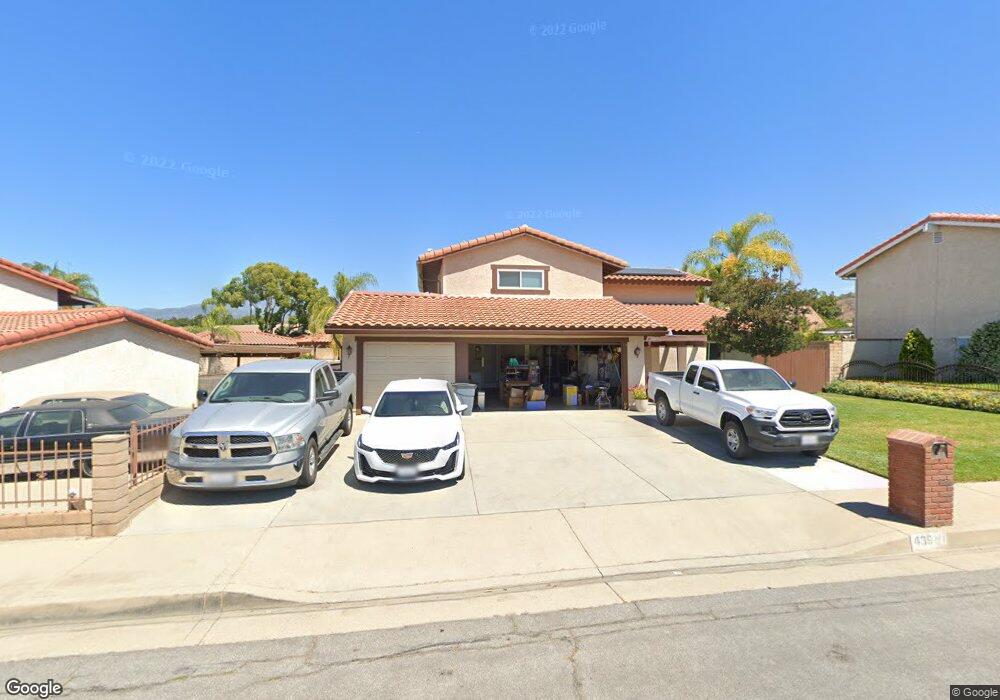
439 E Payson St Glendora, CA 91740
Charter oak NeighborhoodEstimated Value: $893,000 - $996,000
4
Beds
3
Baths
1,986
Sq Ft
$467/Sq Ft
Est. Value
About This Home
This home is located at 439 E Payson St, Glendora, CA 91740 and is currently estimated at $928,061, approximately $467 per square foot. 439 E Payson St is a home located in Los Angeles County with nearby schools including Washington Elementary School, Royal Oak Middle School, and Charter Oak High School.
Ownership History
Date
Name
Owned For
Owner Type
Purchase Details
Closed on
Mar 10, 2018
Sold by
Smith Keith D
Bought by
Smith Keith Douglas and Smith Cindy Lee
Current Estimated Value
Purchase Details
Closed on
Mar 17, 1998
Sold by
Smith Keith D
Bought by
Smith Keith D and Smith Cindy L
Home Financials for this Owner
Home Financials are based on the most recent Mortgage that was taken out on this home.
Original Mortgage
$167,000
Interest Rate
7.02%
Create a Home Valuation Report for This Property
The Home Valuation Report is an in-depth analysis detailing your home's value as well as a comparison with similar homes in the area
Home Values in the Area
Average Home Value in this Area
Purchase History
| Date | Buyer | Sale Price | Title Company |
|---|---|---|---|
| Smith Keith Douglas | -- | None Available | |
| Smith Keith D | -- | Gateway Title Company |
Source: Public Records
Mortgage History
| Date | Status | Borrower | Loan Amount |
|---|---|---|---|
| Closed | Smith Keith D | $167,000 |
Source: Public Records
Tax History
| Year | Tax Paid | Tax Assessment Tax Assessment Total Assessment is a certain percentage of the fair market value that is determined by local assessors to be the total taxable value of land and additions on the property. | Land | Improvement |
|---|---|---|---|---|
| 2025 | $3,992 | $306,490 | $122,590 | $183,900 |
| 2024 | $3,992 | $300,482 | $120,187 | $180,295 |
| 2023 | $3,898 | $294,591 | $117,831 | $176,760 |
| 2022 | $3,846 | $288,816 | $115,521 | $173,295 |
| 2021 | $3,778 | $283,154 | $113,256 | $169,898 |
| 2019 | $3,694 | $274,757 | $109,898 | $164,859 |
| 2018 | $3,460 | $269,371 | $107,744 | $161,627 |
| 2016 | $3,293 | $258,912 | $103,561 | $155,351 |
| 2015 | $3,278 | $255,024 | $102,006 | $153,018 |
| 2014 | $3,276 | $250,029 | $100,008 | $150,021 |
Source: Public Records
Map
Nearby Homes
- 315 E Juanita Ave
- 456 Citrus Oak Rd
- 475 Citrus Oak Rd
- 481 Citrus Oak Rd
- 201 E Arrow Hwy Unit 64
- 201 E Arrow Hwy Unit 70
- 201 E Arrow Hwy Unit 73
- 520 Claraday St Unit 1
- 120 E Renwick Rd
- 5185 N Banna Ave
- 1700 S Glendora Ave Unit 40
- 1700 S Glendora Ave Unit 43
- 119 W Gladstone St
- 20290 E Arrow Hwy Unit C
- 20232 E Arrow Hwy
- 5141 N Lyman Ave
- 905 E Juanita Ave
- 625 -627 S Wabash Ave
- 5113 N Langham Ave
- 19850 E Arrow Hwy Unit E2
- 435 E Camden St
- 420 Greenfield Ct
- 443 E Payson St
- 428 Greenfield Ct
- 412 Greenfield Ct
- 425 E Camden St
- 436 Greenfield Ct
- 436 E Payson St
- 440 E Payson St
- 432 E Payson St
- 408 Greenfield Ct
- 444 E Payson St
- 444 Greenfield Ct
- 417 E Camden St
- 428 E Payson St
- 448 E Payson St
- 421 Greenfield Ct
- 404 Greenfield Ct
- 429 Greenfield Ct
- 413 Greenfield Ct
Your Personal Tour Guide
Ask me questions while you tour the home.