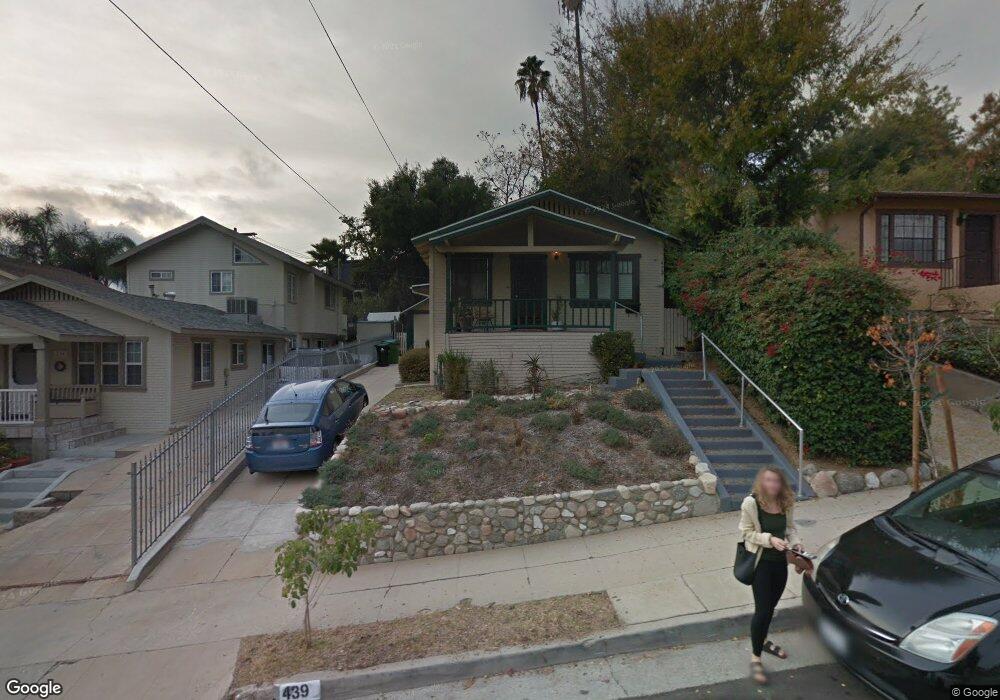
439 Lewis St Los Angeles, CA 90042
Estimated Value: $794,000 - $880,000
3
Beds
1
Bath
946
Sq Ft
$885/Sq Ft
Est. Value
About This Home
This home is located at 439 Lewis St, Los Angeles, CA 90042 and is currently estimated at $837,617, approximately $885 per square foot. 439 Lewis St is a home located in Los Angeles County with nearby schools including Garvanza Elementary, Annandale Elementary, and Luther Burbank Middle School.
Ownership History
Date
Name
Owned For
Owner Type
Purchase Details
Closed on
Aug 20, 2025
Sold by
Mccormick John P and Hahner Margarete
Bought by
Ingram Kerry Brian and Johnson Dana Carol
Current Estimated Value
Home Financials for this Owner
Home Financials are based on the most recent Mortgage that was taken out on this home.
Original Mortgage
$720,000
Outstanding Balance
$719,380
Interest Rate
6.75%
Mortgage Type
New Conventional
Estimated Equity
$118,237
Purchase Details
Closed on
Nov 7, 2003
Sold by
Mccormick John
Bought by
Mccormick John and The John Mccormick Trust
Purchase Details
Closed on
Jul 9, 2003
Sold by
Mccormick John
Bought by
Mccormick John
Home Financials for this Owner
Home Financials are based on the most recent Mortgage that was taken out on this home.
Original Mortgage
$80,000
Interest Rate
5.13%
Mortgage Type
Purchase Money Mortgage
Purchase Details
Closed on
Jan 24, 1998
Sold by
Mccormick John
Bought by
Mccormick John and The John Mccormick Trust
Create a Home Valuation Report for This Property
The Home Valuation Report is an in-depth analysis detailing your home's value as well as a comparison with similar homes in the area
Home Values in the Area
Average Home Value in this Area
Purchase History
| Date | Buyer | Sale Price | Title Company |
|---|---|---|---|
| Ingram Kerry Brian | $800,000 | Chicago Title Company | |
| Mccormick John | -- | -- | |
| Mccormick John | -- | Southland Title | |
| Mccormick John | -- | -- |
Source: Public Records
Mortgage History
| Date | Status | Borrower | Loan Amount |
|---|---|---|---|
| Open | Ingram Kerry Brian | $720,000 | |
| Previous Owner | Mccormick John | $80,000 |
Source: Public Records
Tax History Compared to Growth
Tax History
| Year | Tax Paid | Tax Assessment Tax Assessment Total Assessment is a certain percentage of the fair market value that is determined by local assessors to be the total taxable value of land and additions on the property. | Land | Improvement |
|---|---|---|---|---|
| 2025 | $2,525 | $198,372 | $129,852 | $68,520 |
| 2024 | $2,525 | $194,483 | $127,306 | $67,177 |
| 2023 | $2,479 | $190,670 | $124,810 | $65,860 |
| 2022 | $2,365 | $186,932 | $122,363 | $64,569 |
| 2021 | $2,333 | $183,267 | $119,964 | $63,303 |
| 2019 | $2,265 | $177,832 | $116,406 | $61,426 |
| 2018 | $2,215 | $174,346 | $114,124 | $60,222 |
| 2016 | $2,109 | $167,579 | $109,694 | $57,885 |
| 2015 | $2,079 | $165,063 | $108,047 | $57,016 |
| 2014 | $2,095 | $161,831 | $105,931 | $55,900 |
Source: Public Records
Map
Nearby Homes
- 328 Vista Place
- 6218 Saylin Ln
- 355 Kirby St
- 6225 Beard St
- 426 N Avenue 64
- 935 N Staley Ln
- 0 N Avenue 62
- 234 Newland St
- 829 Cooper Ave
- 310 Branch St
- 1124 Highgrove Terrace
- 322 N Avenue 66 Unit 5
- 215 Branch St
- 1019 N Staley Ln
- 560 Neva Place
- 6565 Pickwick St
- 576 Neva Place
- 1465 Washburn Rd
- 6652 Hough St
- 943 N Avenue 66