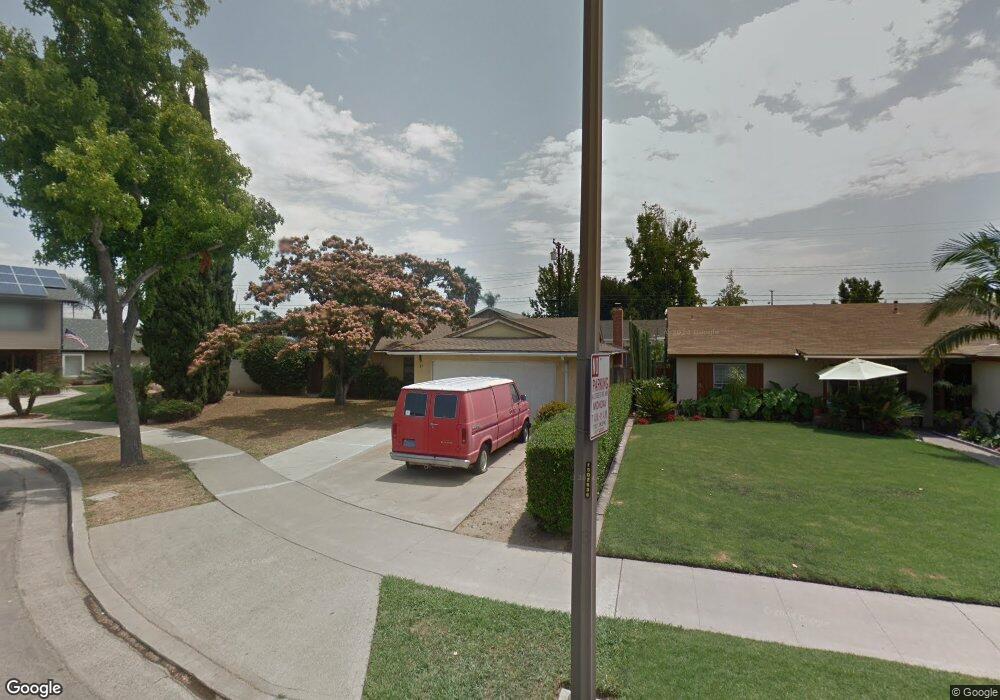
439 N Sacramento St Orange, CA 92867
Estimated Value: $1,013,355 - $1,290,000
3
Beds
2
Baths
1,578
Sq Ft
$717/Sq Ft
Est. Value
About This Home
This home is located at 439 N Sacramento St, Orange, CA 92867 and is currently estimated at $1,131,089, approximately $716 per square foot. 439 N Sacramento St is a home located in Orange County with nearby schools including Handy Elementary School, Yorba Middle School, and Orange High School.
Ownership History
Date
Name
Owned For
Owner Type
Purchase Details
Closed on
Mar 4, 2015
Sold by
Liu Hou Chang and Fu Amy
Bought by
2015 Hou Chang Liu & Amy Fu Living Trust
Current Estimated Value
Purchase Details
Closed on
Mar 6, 2013
Sold by
Champ Development Llc
Bought by
Liu Hou Chang and Fu Amy
Home Financials for this Owner
Home Financials are based on the most recent Mortgage that was taken out on this home.
Original Mortgage
$360,000
Outstanding Balance
$253,235
Interest Rate
3.47%
Mortgage Type
New Conventional
Estimated Equity
$877,854
Purchase Details
Closed on
Dec 1, 2012
Sold by
Gibbs Laurie L
Bought by
Champ Development Llc
Home Financials for this Owner
Home Financials are based on the most recent Mortgage that was taken out on this home.
Original Mortgage
$70,000
Interest Rate
3.27%
Mortgage Type
Stand Alone Second
Purchase Details
Closed on
Mar 15, 1996
Sold by
Carstensen Henry
Bought by
Carstensen Henry and Shank Charly J Brown
Create a Home Valuation Report for This Property
The Home Valuation Report is an in-depth analysis detailing your home's value as well as a comparison with similar homes in the area
Home Values in the Area
Average Home Value in this Area
Purchase History
| Date | Buyer | Sale Price | Title Company |
|---|---|---|---|
| 2015 Hou Chang Liu & Amy Fu Living Trust | -- | None Available | |
| Liu Hou Chang | $450,000 | Fidelity National Title Oran | |
| Champ Development Llc | $340,000 | Fidelity National Title | |
| Carstensen Henry | -- | -- |
Source: Public Records
Mortgage History
| Date | Status | Borrower | Loan Amount |
|---|---|---|---|
| Open | Liu Hou Chang | $360,000 | |
| Previous Owner | Champ Development Llc | $70,000 | |
| Previous Owner | Champ Development Llc | $240,000 |
Source: Public Records
Tax History Compared to Growth
Tax History
| Year | Tax Paid | Tax Assessment Tax Assessment Total Assessment is a certain percentage of the fair market value that is determined by local assessors to be the total taxable value of land and additions on the property. | Land | Improvement |
|---|---|---|---|---|
| 2025 | $6,062 | $554,138 | $457,518 | $96,620 |
| 2024 | $6,062 | $543,273 | $448,547 | $94,726 |
| 2023 | $5,926 | $532,621 | $439,752 | $92,869 |
| 2022 | $5,810 | $522,178 | $431,129 | $91,049 |
| 2021 | $5,647 | $511,940 | $422,676 | $89,264 |
| 2020 | $5,595 | $506,691 | $418,342 | $88,349 |
| 2019 | $5,523 | $496,756 | $410,139 | $86,617 |
| 2018 | $5,438 | $487,016 | $402,097 | $84,919 |
| 2017 | $5,213 | $477,467 | $394,213 | $83,254 |
| 2016 | $5,111 | $468,105 | $386,483 | $81,622 |
| 2015 | $5,036 | $461,074 | $380,678 | $80,396 |
| 2014 | $4,927 | $452,043 | $373,221 | $78,822 |
Source: Public Records
Map
Nearby Homes
- 415 N Wayfield St
- 2515 E Orange Grove Ave
- 234 N Milford St
- 641 N Milford St
- 2705 E Orange Grove Ave
- 316 N Shattuck Place
- 1514 E Palm Ave
- 2929 E Hamilton Ave
- 790 N Fern St
- 811 N Handy St
- 3145 E Scotts View Unit A
- 692 N Adele St Unit 30
- 692 N Adele St Unit 78
- 129 S Kathleen Ln
- 3318 E Chardonnay Ln Unit B
- 1801 E Collins Ave Unit 42
- 1801 E Collins Ave Unit 65
- 1801 E Collins Ave Unit 6
- 448 N Londonderry Ln Unit D
- 201 E Collins Ave Unit 134
- 429 N Sacramento St
- 430 N Milford Rd
- 420 N Milford Rd
- 440 N Milford Rd
- 441 N Sacramento St
- 419 N Sacramento St
- 445 N Sacramento St
- 410 N Milford Rd
- 2229 E Mount Vernon Ave
- 450 N Milford Rd
- 2224 E Mount Vernon Ave
- 409 N Sacramento St
- 2223 E Mount Vernon Ave
- 400 N Milford Rd
- 431 N Milford Rd
- 2218 E Mount Vernon Ave
- 401 N Sacramento St
- 441 N Milford Rd
- 460 N Milford Rd
- 408 N Sacramento St