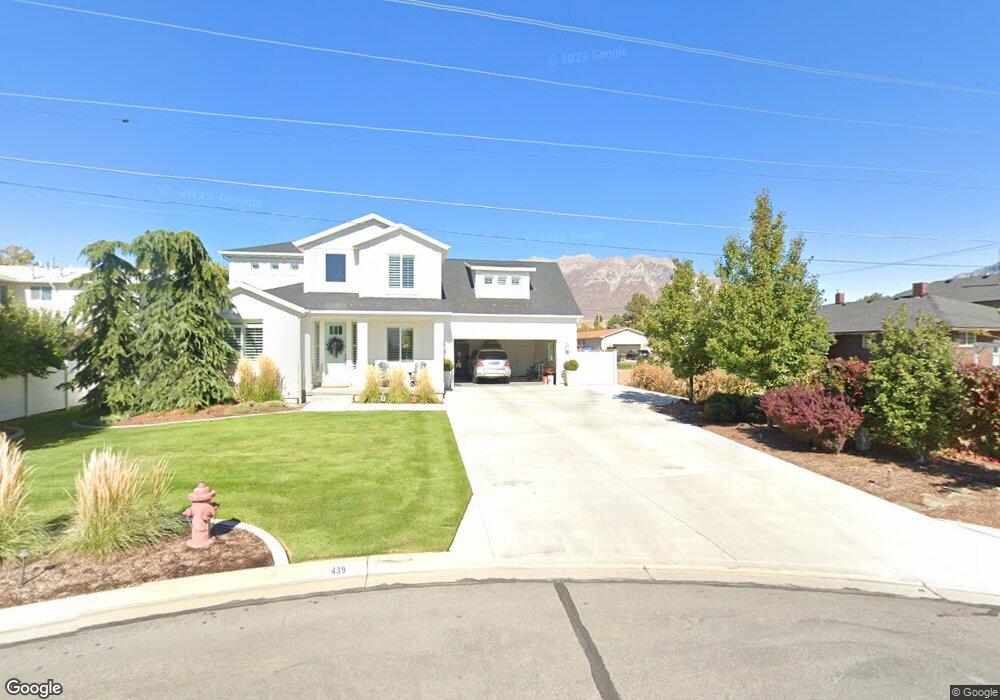
439 S 750 E Orem, UT 84097
SCERA Neighborhood
--
Bed
--
Bath
--
Sq Ft
--
Built
About This Home
This home is located at 439 S 750 E, Orem, UT 84097. 439 S 750 E is a home with nearby schools including Centennial Elementary, Lakeridge Jr High School, and Orem High School.
Create a Home Valuation Report for This Property
The Home Valuation Report is an in-depth analysis detailing your home's value as well as a comparison with similar homes in the area
Home Values in the Area
Average Home Value in this Area
Tax History
| Year | Tax Paid | Tax Assessment Tax Assessment Total Assessment is a certain percentage of the fair market value that is determined by local assessors to be the total taxable value of land and additions on the property. | Land | Improvement |
|---|---|---|---|---|
| 2024 | $3,179 | $388,685 | $0 | $0 |
| 2023 | $2,965 | $389,675 | $0 | $0 |
| 2022 | $2,838 | $361,405 | $0 | $0 |
| 2021 | $2,703 | $521,200 | $139,600 | $381,600 |
| 2020 | $2,563 | $485,800 | $111,700 | $374,100 |
| 2019 | $2,180 | $429,600 | $104,300 | $325,300 |
| 2018 | $2,261 | $425,800 | $100,500 | $325,300 |
| 2017 | $2,171 | $219,010 | $0 | $0 |
| 2016 | $2,223 | $206,745 | $0 | $0 |
| 2015 | $788 | $69,300 | $0 | $0 |
Source: Public Records
Map
Nearby Homes
Your Personal Tour Guide
Ask me questions while you tour the home.