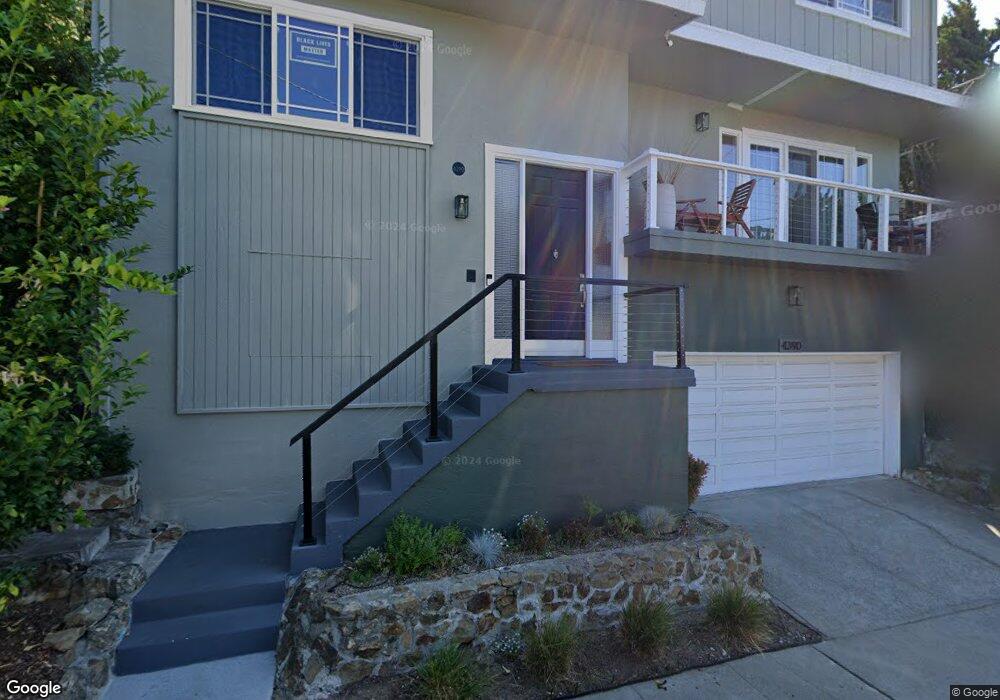
4390 Bridgeview Dr Oakland, CA 94602
Oakmore NeighborhoodEstimated Value: $1,309,000 - $1,505,000
4
Beds
3
Baths
2,120
Sq Ft
$651/Sq Ft
Est. Value
About This Home
This home is located at 4390 Bridgeview Dr, Oakland, CA 94602 and is currently estimated at $1,380,480, approximately $651 per square foot. 4390 Bridgeview Dr is a home located in Alameda County with nearby schools including Joaquin Miller Elementary School, Montera Middle School, and Skyline High School.
Ownership History
Date
Name
Owned For
Owner Type
Purchase Details
Closed on
Feb 12, 2021
Sold by
Timmons Perry and Timmons Michelle Pope
Bought by
Timmons Perry and Timmons Michelle
Current Estimated Value
Home Financials for this Owner
Home Financials are based on the most recent Mortgage that was taken out on this home.
Original Mortgage
$323,700
Outstanding Balance
$289,514
Interest Rate
2.7%
Mortgage Type
New Conventional
Estimated Equity
$1,090,966
Purchase Details
Closed on
Jun 5, 2003
Sold by
Heller Robert A and Heller Elaine E
Bought by
Timmons Perry and Timmons Michelle Pope
Home Financials for this Owner
Home Financials are based on the most recent Mortgage that was taken out on this home.
Original Mortgage
$410,000
Interest Rate
3.87%
Mortgage Type
Purchase Money Mortgage
Purchase Details
Closed on
Oct 1, 1996
Sold by
Guerrieri Joseph A and Guerrieri Alberta N
Bought by
Heller Robert A and Heller Elaine E
Home Financials for this Owner
Home Financials are based on the most recent Mortgage that was taken out on this home.
Original Mortgage
$162,000
Interest Rate
7.62%
Create a Home Valuation Report for This Property
The Home Valuation Report is an in-depth analysis detailing your home's value as well as a comparison with similar homes in the area
Home Values in the Area
Average Home Value in this Area
Purchase History
| Date | Buyer | Sale Price | Title Company |
|---|---|---|---|
| Timmons Perry | -- | Old Republic Title Company | |
| Timmons Perry | $625,000 | Fidelity National Title Co | |
| Heller Robert A | $273,000 | First American Title Guarant |
Source: Public Records
Mortgage History
| Date | Status | Borrower | Loan Amount |
|---|---|---|---|
| Open | Timmons Perry | $323,700 | |
| Closed | Timmons Perry | $410,000 | |
| Previous Owner | Heller Robert A | $162,000 |
Source: Public Records
Tax History
| Year | Tax Paid | Tax Assessment Tax Assessment Total Assessment is a certain percentage of the fair market value that is determined by local assessors to be the total taxable value of land and additions on the property. | Land | Improvement |
|---|---|---|---|---|
| 2025 | $13,041 | $905,124 | $271,537 | $633,587 |
| 2024 | $13,041 | $887,380 | $266,214 | $621,166 |
| 2023 | $13,744 | $869,987 | $260,996 | $608,991 |
| 2022 | $13,422 | $852,930 | $255,879 | $597,051 |
| 2021 | $12,915 | $836,211 | $250,863 | $585,348 |
| 2020 | $12,776 | $827,643 | $248,293 | $579,350 |
| 2019 | $12,349 | $811,418 | $243,425 | $567,993 |
| 2018 | $12,092 | $795,511 | $238,653 | $556,858 |
| 2017 | $11,651 | $779,918 | $233,975 | $545,943 |
| 2016 | $11,318 | $764,630 | $229,389 | $535,241 |
| 2015 | $11,262 | $753,150 | $225,945 | $527,205 |
| 2014 | $11,470 | $738,400 | $221,520 | $516,880 |
Source: Public Records
Map
Nearby Homes
- 1902 Hoover Ave
- 1989 Oakview Dr
- 1120 Hollywood Ave Unit 1
- 1124 Hollywood Ave Unit 3
- 4445 Arcadia Ave
- 1024 Elsinore Ave
- 2025 Braemar Rd
- 1200 El Centro Ave
- 1210 Everett Ave
- 943 Glendome Cir
- 4426 Park Blvd
- 22 Valant Place
- 3862 Lyman Rd
- 2615 La Cuesta Ave
- 1524 Hampel St
- 236 King Ave Unit C
- 1515 Hampel St
- 2550 Carmel St
- 3927 Canon Ave
- 1424 Hampel St
- 4400 Bridgeview Dr
- 4382 Bridgeview Dr
- 1826 Leimert Blvd
- 1834 Leimert Blvd
- 4374 Bridgeview Dr
- 4410 Bridgeview Dr
- 1816 Leimert Blvd
- 4385 Bridgeview Dr
- 4366 Bridgeview Dr
- 4375 Bridgeview Dr
- 1808 Leimert Blvd
- 4420 Bridgeview Dr
- 4358 Bridgeview Dr
- 4361 Bridgeview Dr
- 1845 Leimert Blvd
- 1800 Leimert Blvd
- 4350 Arden Place
- 4374 Arden Place
- 1817 Leimert Blvd
- 4350 Bridgeview Dr
Your Personal Tour Guide
Ask me questions while you tour the home.