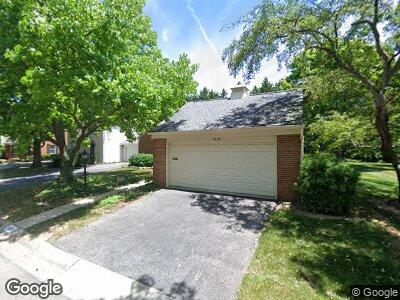
4392 Airendel Ct Unit E1 Columbus, OH 43220
Estimated Value: $359,609 - $386,000
2
Beds
2
Baths
1,478
Sq Ft
$249/Sq Ft
Est. Value
About This Home
This home is located at 4392 Airendel Ct Unit E1, Columbus, OH 43220 and is currently estimated at $367,652, approximately $248 per square foot. 4392 Airendel Ct Unit E1 is a home located in Franklin County with nearby schools including Greensview Elementary School, Hastings Middle School, and Upper Arlington High School.
Ownership History
Date
Name
Owned For
Owner Type
Purchase Details
Closed on
Aug 15, 2011
Sold by
Kauffman Sarah K
Bought by
Rader Suzanna L and Sarah D Kauffman Family Preservation Tru
Current Estimated Value
Purchase Details
Closed on
Feb 14, 2007
Sold by
Kauffman Sarah D
Bought by
Kauffman Sarah D and Sarah D Kauffman Revocable Living Trust
Purchase Details
Closed on
Nov 22, 2004
Sold by
Davis Roger O
Bought by
Kauffman Sarah D
Home Financials for this Owner
Home Financials are based on the most recent Mortgage that was taken out on this home.
Original Mortgage
$293,000
Interest Rate
5.82%
Mortgage Type
Purchase Money Mortgage
Purchase Details
Closed on
Sep 10, 2004
Sold by
Davis Lucy A and Davis Roger O
Bought by
Davis Roger O
Purchase Details
Closed on
Apr 17, 1985
Bought by
Davis Roger O
Create a Home Valuation Report for This Property
The Home Valuation Report is an in-depth analysis detailing your home's value as well as a comparison with similar homes in the area
Home Values in the Area
Average Home Value in this Area
Purchase History
| Date | Buyer | Sale Price | Title Company |
|---|---|---|---|
| Rader Suzanna L | -- | Attorney | |
| Kauffman Sarah D | -- | Attorney | |
| Kauffman Sarah D | -- | Attorney | |
| Kauffman Sarah D | $188,000 | Title First | |
| Davis Roger O | $92,000 | -- |
Source: Public Records
Mortgage History
| Date | Status | Borrower | Loan Amount |
|---|---|---|---|
| Open | Sarah D Kauffman Family Preser | $75,000 | |
| Previous Owner | Kauffman Sarah D | $140,175 | |
| Previous Owner | Kauffman Sarah D | $293,000 | |
| Previous Owner | Davis Roger O | $5,000 |
Source: Public Records
Tax History Compared to Growth
Tax History
| Year | Tax Paid | Tax Assessment Tax Assessment Total Assessment is a certain percentage of the fair market value that is determined by local assessors to be the total taxable value of land and additions on the property. | Land | Improvement |
|---|---|---|---|---|
| 2024 | $11,783 | $104,410 | $24,500 | $79,910 |
| 2023 | $5,644 | $104,410 | $24,500 | $79,910 |
| 2022 | $5,216 | $81,200 | $26,950 | $54,250 |
| 2021 | $4,482 | $81,200 | $26,950 | $54,250 |
| 2020 | $4,456 | $81,200 | $26,950 | $54,250 |
| 2019 | $4,512 | $73,820 | $24,500 | $49,320 |
| 2018 | $4,167 | $73,820 | $24,500 | $49,320 |
| 2017 | $4,164 | $73,820 | $24,500 | $49,320 |
| 2016 | $3,851 | $67,000 | $13,480 | $53,520 |
| 2015 | $3,848 | $67,000 | $13,480 | $53,520 |
| 2014 | $3,852 | $67,000 | $13,480 | $53,520 |
| 2013 | $1,812 | $60,900 | $12,250 | $48,650 |
Source: Public Records
Map
Nearby Homes
- 1293 Ducrest Dr S
- 1211 Darcann Dr
- 4216 Chaucer Ln
- 1371 Reymond Rd
- 1330 Darcann Dr
- 975 Kennington Ave
- 1022 Galliton Ct Unit C
- 1225 Brittany Ln
- 4502 Loos Cir E
- 685 Olde Settler Place
- 1610 Lafayette Dr Unit 1610
- 4644 NW Professional Plaza
- 4883 McBane St
- 1680 Sussex Ct
- 4159 Rowanne Rd
- 3982 Pegg Ave
- 1004 Kenwood Ln
- 4460 Reed Rd
- 3823 Beecham Ct
- 1155 Millcreek Ct
- 4392 Airendel Ct Unit E1
- 4396 Airendel Ct Unit E2
- 4400 Airendel Ct
- 4372 Airendel Ct Unit D4
- 4404 Airendel Ct Unit E4
- 4404 Airendel Ct Unit 4
- 4393 Airendel Ct
- 4368 Airendel Ct Unit D3
- 4368 Airendel Ct Unit 3
- 4397 Airendel Ct Unit F2
- 4403 Airendel Ct
- 4403 Airendel Ct Unit F-3
- 4407 Airendel Ct
- 1160 Airendel Ln Unit G3
- 1160 Airendel Ln Unit 3
- 4364 Airendel Ct
- 4364 Airendel Ct Unit 2
- 1164 Airendel Ln
- 4360 Airendel Ct Unit D1
- 4360 Airendel Ct Unit 1