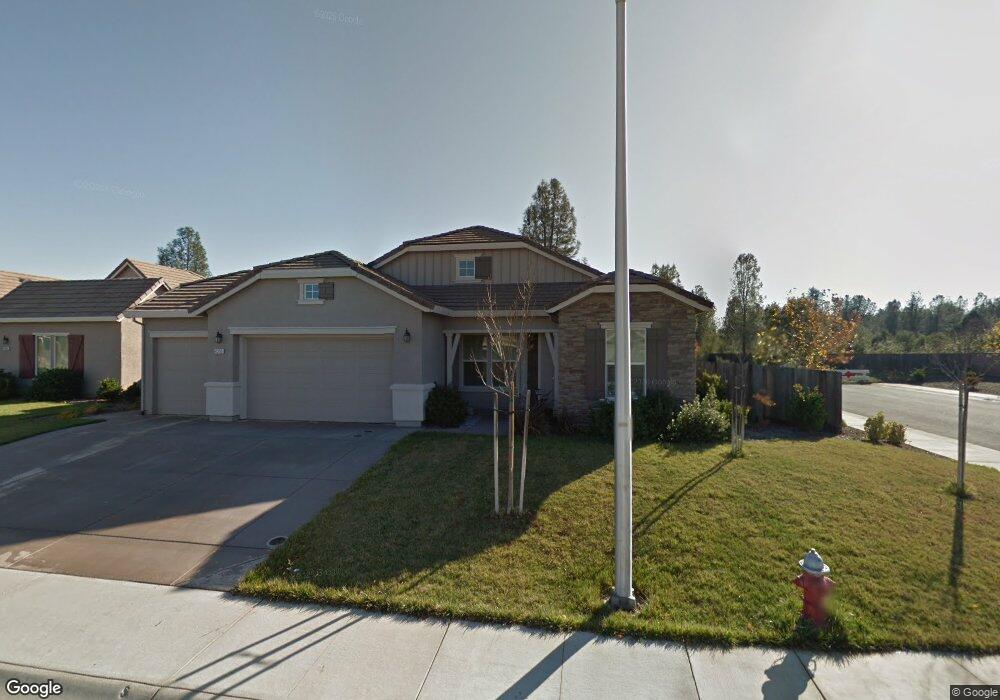
4395 Chinook Dr Redding, CA 96002
South Bechelli NeighborhoodEstimated Value: $471,076 - $576,000
4
Beds
2
Baths
2,077
Sq Ft
$246/Sq Ft
Est. Value
About This Home
This home is located at 4395 Chinook Dr, Redding, CA 96002 and is currently estimated at $511,269, approximately $246 per square foot. 4395 Chinook Dr is a home located in Shasta County with nearby schools including Lassen View Elementary School, Parsons Junior High School, and Enterprise High School.
Ownership History
Date
Name
Owned For
Owner Type
Purchase Details
Closed on
Aug 5, 2010
Sold by
Hellman Patricia A
Bought by
Yu Ying Keung and Yu Mei Yi
Current Estimated Value
Home Financials for this Owner
Home Financials are based on the most recent Mortgage that was taken out on this home.
Original Mortgage
$230,000
Outstanding Balance
$151,898
Interest Rate
4.52%
Mortgage Type
New Conventional
Estimated Equity
$359,371
Purchase Details
Closed on
Dec 21, 2009
Sold by
Hellman Patricia A
Bought by
Hellman Patricia A
Purchase Details
Closed on
Nov 12, 2009
Sold by
Hellman Patricia A
Bought by
Hellman Patricia A
Purchase Details
Closed on
Feb 6, 2009
Sold by
D R Horton Inc Sacramento
Bought by
Hellman Patricia A
Purchase Details
Closed on
Jan 28, 2009
Sold by
Hellman Gerald F
Bought by
Hellman Patricia A
Create a Home Valuation Report for This Property
The Home Valuation Report is an in-depth analysis detailing your home's value as well as a comparison with similar homes in the area
Home Values in the Area
Average Home Value in this Area
Purchase History
We collect this data history from publicly available records. To have your information removed, we recommend requesting removal directly through your county’s website.
| Date | Buyer | Sale Price | Title Company |
|---|---|---|---|
| Yu Ying Keung | $287,500 | Fidelity Natl Title Co Of Ca | |
| Hellman Patricia A | -- | None Available | |
| Hellman Patricia A | -- | None Available | |
| Hellman Patricia A | $316,500 | Fidelity National Title Co | |
| Hellman Patricia A | -- | Fidelity National Title Co |
Source: Public Records
Mortgage History
We collect this data history from publicly available records. To have your information removed, we recommend requesting removal directly through your county’s website.
| Date | Status | Borrower | Loan Amount |
|---|---|---|---|
| Open | Yu Ying Keung | $230,000 |
Source: Public Records
Tax History
| Year | Tax Paid | Tax Assessment Tax Assessment Total Assessment is a certain percentage of the fair market value that is determined by local assessors to be the total taxable value of land and additions on the property. | Land | Improvement |
|---|---|---|---|---|
| 2025 | $4,271 | $368,327 | $76,865 | $291,462 |
| 2024 | $4,202 | $361,106 | $75,358 | $285,748 |
| 2023 | $4,202 | $354,027 | $73,881 | $280,146 |
| 2022 | $4,080 | $347,086 | $72,433 | $274,653 |
| 2021 | $3,948 | $340,281 | $71,013 | $269,268 |
| 2020 | $3,879 | $336,792 | $70,285 | $266,507 |
| 2019 | $3,757 | $330,189 | $68,907 | $261,282 |
| 2018 | $3,670 | $323,715 | $67,556 | $256,159 |
| 2017 | $3,917 | $317,369 | $66,232 | $251,137 |
| 2016 | $3,662 | $311,147 | $64,934 | $246,213 |
| 2015 | $3,517 | $306,474 | $63,959 | $242,515 |
| 2014 | $3,505 | $300,472 | $62,707 | $237,765 |
Source: Public Records
Map
Nearby Homes
- 751 Woodacre Dr
- 4323 Churn Crk Rd
- 4181 Diane St
- 1144 Denton Way
- 4020 Churn Creek Rd
- 1198 Denton Way
- 1228 Ledell Dr
- 3857 Eagle Pkwy
- 3764 Eagle Pkwy
- 1281 Heavenly Oak Ln
- 1299 Heavenly Oak Ln
- 1340 Alrose Ln
- 5367 Rosswood Ln
- 3708 Traverse St
- 688 Julie Way
- 4877 Squirrel Run Ct
- 3689 Suzanne Way
- 3682 Suzanne Way
- 3475 Nicolet Ln
- 3500 Pioneer Ln
- 4385 Chinook Dr
- 4401 Chinook Dr
- 4375 Chinook Dr
- 796 Rivercrest Pkwy
- 4408 Chinook Dr
- 4376 Chinook Dr
- 4365 Chinook Dr
- 4417 Chinook Dr
- 752 Rivercrest Pkwy
- 4355 Chinook Dr
- 4358 Chinook Dr
- 4432 Chinook Dr
- 4433 Chinook Dr
- 4347 Kestrel Ct
- 749 Rivercrest Pkwy
- 4340 Chinook Dr
- 4458 Chinook Dr
- 4449 Chinook Dr
- 705 Rivercrest Pkwy
- 4301 Kestrel Ct
Your Personal Tour Guide
Ask me questions while you tour the home.