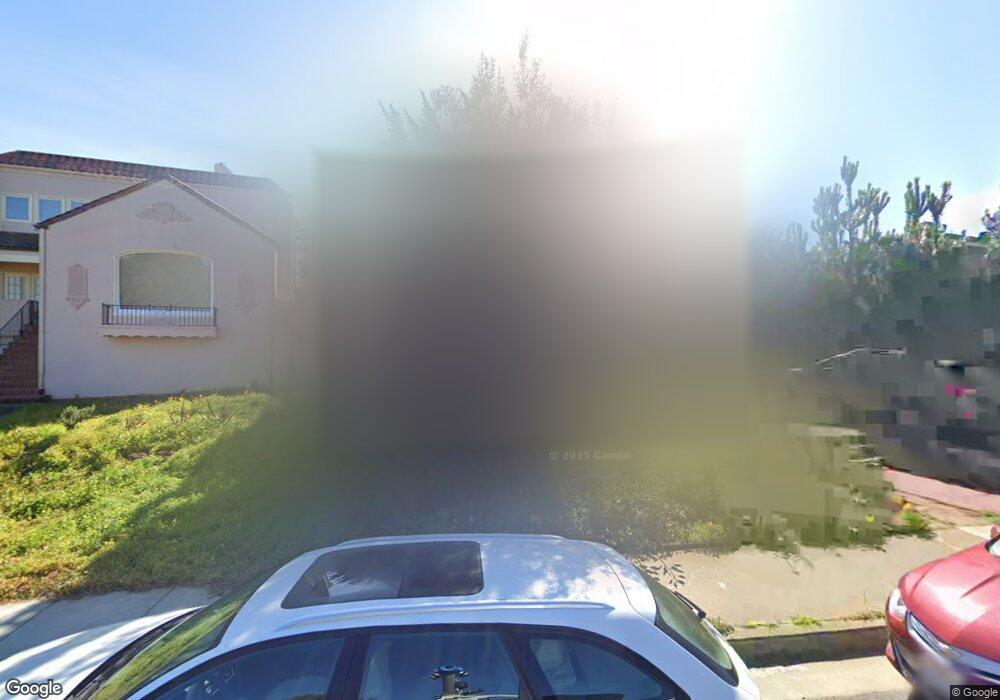
44 Alviso St San Francisco, CA 94127
Ingleside Terrace NeighborhoodEstimated Value: $1,477,000 - $2,087,000
2
Beds
1
Bath
1,711
Sq Ft
$1,037/Sq Ft
Est. Value
About This Home
This home is located at 44 Alviso St, San Francisco, CA 94127 and is currently estimated at $1,773,902, approximately $1,036 per square foot. 44 Alviso St is a home located in San Francisco County with nearby schools including Commodore Sloat Elementary School, Aptos Middle School, and St. Stephen School.
Ownership History
Date
Name
Owned For
Owner Type
Purchase Details
Closed on
Sep 13, 2024
Sold by
Beeler Caroline R
Bought by
Caroline Beeler Trust and Beeler
Current Estimated Value
Purchase Details
Closed on
Jan 16, 2016
Sold by
Beeler John H
Bought by
Beeler Caroline R
Purchase Details
Closed on
Jun 16, 2000
Sold by
Beeler John H and Beeler Caroline R
Bought by
Beeler John H and Beeler Caroline R
Purchase Details
Closed on
Jul 26, 1999
Sold by
Beeler John H
Bought by
Beeler John H and Ryzy Ryski Caroline R
Home Financials for this Owner
Home Financials are based on the most recent Mortgage that was taken out on this home.
Original Mortgage
$240,000
Interest Rate
7.64%
Purchase Details
Closed on
Jul 30, 1996
Sold by
Brown Mary E
Bought by
Brown Mary E
Create a Home Valuation Report for This Property
The Home Valuation Report is an in-depth analysis detailing your home's value as well as a comparison with similar homes in the area
Home Values in the Area
Average Home Value in this Area
Purchase History
| Date | Buyer | Sale Price | Title Company |
|---|---|---|---|
| Caroline Beeler Trust | -- | None Listed On Document | |
| Beeler Caroline R | -- | None Available | |
| Beeler John H | -- | North American Title Co | |
| Beeler John H | -- | North American Title Co | |
| Beeler John H | $466,000 | North American Title Co | |
| Brown Mary E | -- | -- |
Source: Public Records
Mortgage History
| Date | Status | Borrower | Loan Amount |
|---|---|---|---|
| Previous Owner | Beeler John H | $240,000 |
Source: Public Records
Tax History Compared to Growth
Tax History
| Year | Tax Paid | Tax Assessment Tax Assessment Total Assessment is a certain percentage of the fair market value that is determined by local assessors to be the total taxable value of land and additions on the property. | Land | Improvement |
|---|---|---|---|---|
| 2025 | $9,979 | $807,365 | $408,828 | $398,537 |
| 2024 | $9,979 | $791,506 | $400,796 | $390,710 |
| 2023 | $9,822 | $775,988 | $392,938 | $383,050 |
| 2022 | $9,625 | $760,776 | $385,234 | $375,542 |
| 2021 | $9,451 | $745,862 | $377,682 | $368,180 |
| 2020 | $9,504 | $738,218 | $373,810 | $364,408 |
| 2019 | $9,179 | $723,746 | $366,482 | $357,264 |
| 2018 | $8,869 | $709,558 | $359,298 | $350,260 |
| 2017 | $8,465 | $695,648 | $352,254 | $343,394 |
| 2016 | $7,404 | $605,010 | $345,348 | $259,662 |
| 2015 | $7,310 | $595,924 | $340,162 | $255,762 |
| 2014 | $7,117 | $584,252 | $333,500 | $250,752 |
Source: Public Records
Map
Nearby Homes