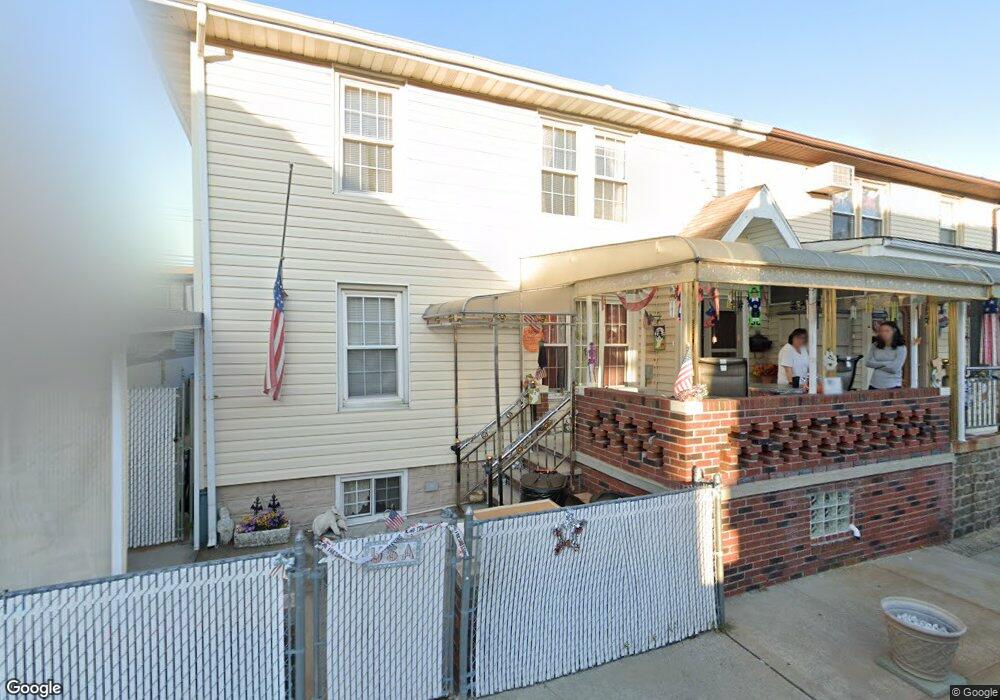
44 Bevy Ct Brooklyn, NY 11229
Gerritsen Beach NeighborhoodEstimated Value: $685,042 - $852,000
--
Bed
--
Bath
1,344
Sq Ft
$559/Sq Ft
Est. Value
About This Home
This home is located at 44 Bevy Ct, Brooklyn, NY 11229 and is currently estimated at $751,261, approximately $558 per square foot. 44 Bevy Ct is a home located in Kings County with nearby schools including P.S. 277 Gerritsen Beach, J.H.S. 278 Marine Park, and New Visions Charter High School for Advanced Math/ Science.
Ownership History
Date
Name
Owned For
Owner Type
Purchase Details
Closed on
Apr 19, 1996
Sold by
Barrett William
Bought by
Cascio Michael A and Cascio Carol Ann
Current Estimated Value
Home Financials for this Owner
Home Financials are based on the most recent Mortgage that was taken out on this home.
Original Mortgage
$105,000
Outstanding Balance
$5,209
Interest Rate
7.91%
Estimated Equity
$746,052
Create a Home Valuation Report for This Property
The Home Valuation Report is an in-depth analysis detailing your home's value as well as a comparison with similar homes in the area
Home Values in the Area
Average Home Value in this Area
Purchase History
| Date | Buyer | Sale Price | Title Company |
|---|---|---|---|
| Cascio Michael A | $135,000 | Commonwealth Land Title Ins |
Source: Public Records
Mortgage History
| Date | Status | Borrower | Loan Amount |
|---|---|---|---|
| Open | Cascio Michael A | $105,000 |
Source: Public Records
Tax History Compared to Growth
Tax History
| Year | Tax Paid | Tax Assessment Tax Assessment Total Assessment is a certain percentage of the fair market value that is determined by local assessors to be the total taxable value of land and additions on the property. | Land | Improvement |
|---|---|---|---|---|
| 2025 | $1,957 | $38,760 | $7,080 | $31,680 |
| 2024 | $1,957 | $35,820 | $7,080 | $28,740 |
| 2023 | $1,960 | $37,200 | $7,080 | $30,120 |
| 2022 | $1,783 | $30,300 | $7,080 | $23,220 |
| 2021 | $1,913 | $27,420 | $7,080 | $20,340 |
| 2020 | $1,913 | $25,680 | $7,080 | $18,600 |
| 2019 | $1,702 | $25,080 | $7,080 | $18,000 |
| 2018 | $1,532 | $21,496 | $4,538 | $16,958 |
| 2017 | $1,594 | $21,496 | $5,982 | $15,514 |
| 2016 | $1,737 | $20,479 | $5,555 | $14,924 |
| 2015 | $596 | $19,320 | $7,860 | $11,460 |
| 2014 | $596 | $18,810 | $7,652 | $11,158 |
Source: Public Records
Map
Nearby Homes