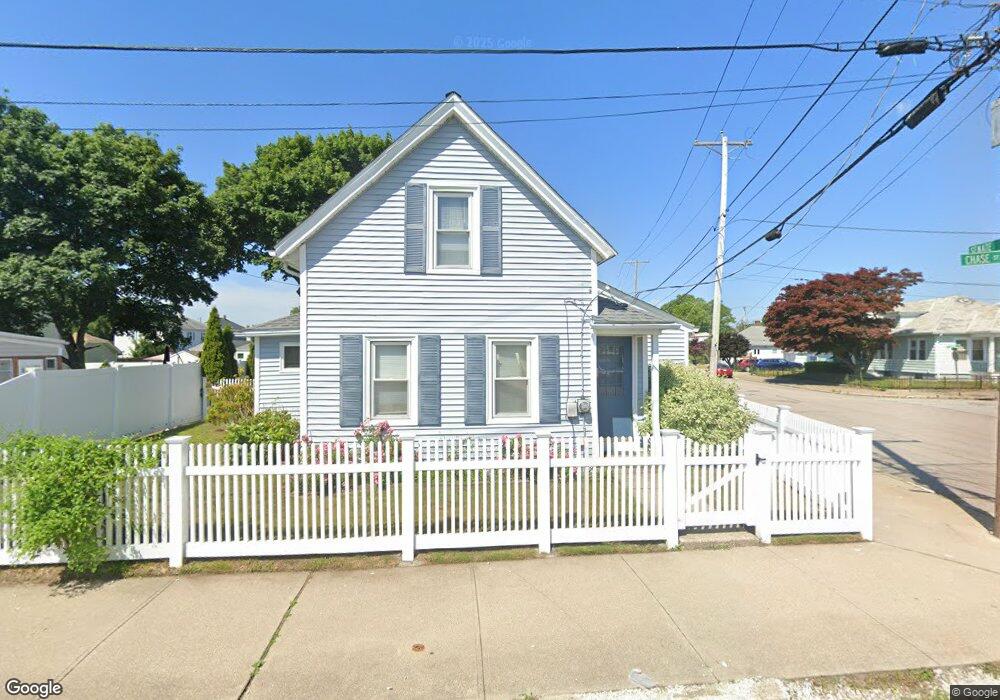
44 Chase St Pawtucket, RI 02861
Darlington NeighborhoodEstimated Value: $349,000 - $400,000
3
Beds
1
Bath
1,279
Sq Ft
$293/Sq Ft
Est. Value
About This Home
This home is located at 44 Chase St, Pawtucket, RI 02861 and is currently estimated at $374,319, approximately $292 per square foot. 44 Chase St is a home located in Providence County with nearby schools including St Cecilia School and Dayspring Christian Academy.
Ownership History
Date
Name
Owned For
Owner Type
Purchase Details
Closed on
Nov 29, 2021
Sold by
Liddle Alfred H and Liddle Louise G
Bought by
Gingras Ryan P
Current Estimated Value
Home Financials for this Owner
Home Financials are based on the most recent Mortgage that was taken out on this home.
Original Mortgage
$168,000
Outstanding Balance
$153,750
Interest Rate
3.05%
Mortgage Type
Purchase Money Mortgage
Estimated Equity
$220,569
Purchase Details
Closed on
Dec 22, 2015
Sold by
Kessler Nicole and Pate Michele
Bought by
Liddle Louise G and Liddle Alfred H
Create a Home Valuation Report for This Property
The Home Valuation Report is an in-depth analysis detailing your home's value as well as a comparison with similar homes in the area
Home Values in the Area
Average Home Value in this Area
Purchase History
| Date | Buyer | Sale Price | Title Company |
|---|---|---|---|
| Gingras Ryan P | $210,000 | None Available | |
| Liddle Louise G | -- | -- |
Source: Public Records
Mortgage History
| Date | Status | Borrower | Loan Amount |
|---|---|---|---|
| Open | Gingras Ryan P | $168,000 |
Source: Public Records
Tax History
| Year | Tax Paid | Tax Assessment Tax Assessment Total Assessment is a certain percentage of the fair market value that is determined by local assessors to be the total taxable value of land and additions on the property. | Land | Improvement |
|---|---|---|---|---|
| 2025 | $4,291 | $326,300 | $156,700 | $169,600 |
| 2024 | $4,027 | $326,300 | $156,700 | $169,600 |
| 2023 | $3,925 | $231,700 | $71,700 | $160,000 |
| 2022 | $3,842 | $231,700 | $71,700 | $160,000 |
| 2021 | $3,842 | $231,700 | $71,700 | $160,000 |
| 2020 | $3,675 | $175,900 | $64,800 | $111,100 |
| 2019 | $3,675 | $175,900 | $64,800 | $111,100 |
| 2018 | $3,541 | $175,900 | $64,800 | $111,100 |
| 2017 | $3,358 | $147,800 | $50,700 | $97,100 |
| 2016 | $3,235 | $147,800 | $50,700 | $97,100 |
| 2015 | $3,235 | $147,800 | $50,700 | $97,100 |
| 2014 | $3,067 | $133,000 | $50,700 | $82,300 |
Source: Public Records
Map
Nearby Homes
Your Personal Tour Guide
Ask me questions while you tour the home.