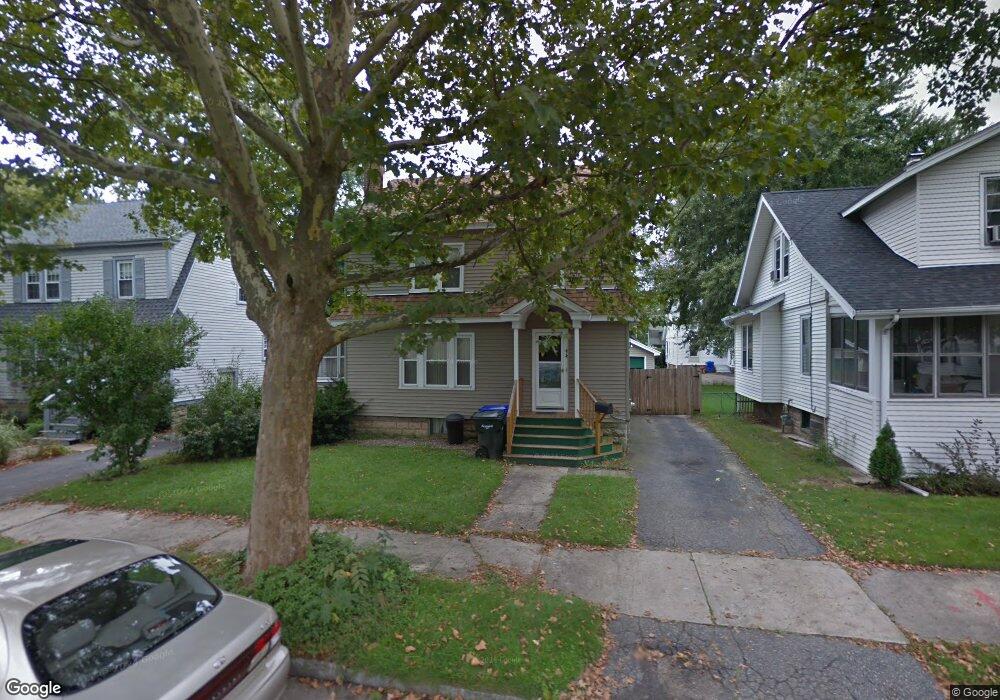
44 Chilson St Springfield, MA 01118
East Forest Park NeighborhoodEstimated Value: $281,266 - $318,000
3
Beds
1
Bath
1,791
Sq Ft
$168/Sq Ft
Est. Value
About This Home
This home is located at 44 Chilson St, Springfield, MA 01118 and is currently estimated at $300,067, approximately $167 per square foot. 44 Chilson St is a home located in Hampden County with nearby schools including Frederick Harris Elementary School, M Marcus Kiley Middle, and High School Of Commerce.
Ownership History
Date
Name
Owned For
Owner Type
Purchase Details
Closed on
Jun 28, 1996
Sold by
Porter Samuel and Porter Elizabeth S
Bought by
Hearn Raymond W and Hearn Michele M
Current Estimated Value
Home Financials for this Owner
Home Financials are based on the most recent Mortgage that was taken out on this home.
Original Mortgage
$67,925
Interest Rate
8.05%
Mortgage Type
Purchase Money Mortgage
Create a Home Valuation Report for This Property
The Home Valuation Report is an in-depth analysis detailing your home's value as well as a comparison with similar homes in the area
Home Values in the Area
Average Home Value in this Area
Purchase History
| Date | Buyer | Sale Price | Title Company |
|---|---|---|---|
| Hearn Raymond W | $71,500 | -- |
Source: Public Records
Mortgage History
| Date | Status | Borrower | Loan Amount |
|---|---|---|---|
| Open | Hearn Raymond W | $116,000 | |
| Closed | Hearn Raymond W | $89,900 | |
| Closed | Hearn Raymond W | $39,500 | |
| Closed | Hearn Raymond W | $67,925 |
Source: Public Records
Tax History
| Year | Tax Paid | Tax Assessment Tax Assessment Total Assessment is a certain percentage of the fair market value that is determined by local assessors to be the total taxable value of land and additions on the property. | Land | Improvement |
|---|---|---|---|---|
| 2025 | $3,501 | $223,300 | $36,800 | $186,500 |
| 2024 | $3,565 | $222,000 | $36,800 | $185,200 |
| 2023 | $3,268 | $191,700 | $35,100 | $156,600 |
| 2022 | $3,435 | $182,500 | $35,100 | $147,400 |
| 2021 | $3,052 | $161,500 | $31,900 | $129,600 |
| 2020 | $2,945 | $150,800 | $31,900 | $118,900 |
| 2019 | $2,893 | $147,000 | $31,900 | $115,100 |
| 2018 | $2,887 | $146,700 | $31,900 | $114,800 |
| 2017 | $2,591 | $131,800 | $30,500 | $101,300 |
| 2016 | $2,440 | $124,100 | $30,500 | $93,600 |
| 2015 | $2,443 | $124,200 | $30,500 | $93,700 |
Source: Public Records
Map
Nearby Homes
- 34 Castle St
- 13 Bither St
- 77 Dorset St
- 161 Dorset St
- 1088 Sumner Ave
- 46 Eckington St
- 88 Brunswick St
- 854-856 Sumner Ave
- 79 Roosevelt Ave
- 134 Eddywood St
- 59 Daviston St
- 119 Powell Ave
- 914-916 Belmont Ave
- 79 Arvilla St
- 22 Eleanor Rd
- 70-72 E Alvord St
- 170 Plumtree Rd
- 33-35 Ruskin St
- 38 Manchester Terrace
- 26 Dwight Rd
Your Personal Tour Guide
Ask me questions while you tour the home.