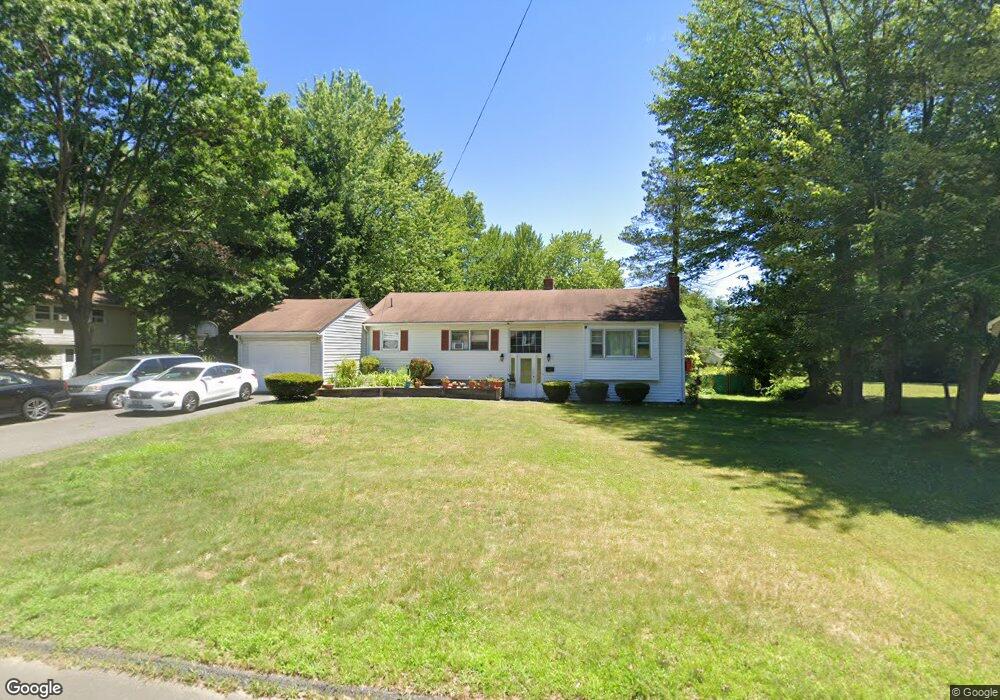
44 Gloria St Windsor, CT 06095
Estimated Value: $413,000 - $476,545
6
Beds
3
Baths
2,062
Sq Ft
$219/Sq Ft
Est. Value
About This Home
This home is located at 44 Gloria St, Windsor, CT 06095 and is currently estimated at $450,886, approximately $218 per square foot. 44 Gloria St is a home located in Hartford County with nearby schools including Poquonock Elementary School, Clover Street School, and Sage Park Middle School.
Ownership History
Date
Name
Owned For
Owner Type
Purchase Details
Closed on
Aug 8, 2003
Sold by
Fleeting Robert and Austin Derek
Bought by
Satchell Clifford and Satchell Jean
Current Estimated Value
Home Financials for this Owner
Home Financials are based on the most recent Mortgage that was taken out on this home.
Original Mortgage
$199,500
Interest Rate
5.28%
Mortgage Type
Purchase Money Mortgage
Purchase Details
Closed on
Nov 19, 1999
Sold by
Farley James and Farley Dorothy
Bought by
Austin Derek
Home Financials for this Owner
Home Financials are based on the most recent Mortgage that was taken out on this home.
Original Mortgage
$143,150
Interest Rate
2.08%
Mortgage Type
Purchase Money Mortgage
Create a Home Valuation Report for This Property
The Home Valuation Report is an in-depth analysis detailing your home's value as well as a comparison with similar homes in the area
Home Values in the Area
Average Home Value in this Area
Purchase History
| Date | Buyer | Sale Price | Title Company |
|---|---|---|---|
| Satchell Clifford | $210,000 | -- | |
| Austin Derek | $147,000 | -- |
Source: Public Records
Mortgage History
| Date | Status | Borrower | Loan Amount |
|---|---|---|---|
| Open | Austin Derek | $252,000 | |
| Closed | Austin Derek | $199,500 | |
| Previous Owner | Austin Derek | $166,224 | |
| Previous Owner | Austin Derek | $143,150 |
Source: Public Records
Tax History Compared to Growth
Tax History
| Year | Tax Paid | Tax Assessment Tax Assessment Total Assessment is a certain percentage of the fair market value that is determined by local assessors to be the total taxable value of land and additions on the property. | Land | Improvement |
|---|---|---|---|---|
| 2025 | $7,161 | $251,720 | $55,930 | $195,790 |
| 2024 | $7,632 | $251,720 | $55,930 | $195,790 |
| 2023 | $5,388 | $160,370 | $39,410 | $120,960 |
| 2022 | $5,336 | $160,370 | $39,410 | $120,960 |
| 2021 | $5,336 | $160,370 | $39,410 | $120,960 |
| 2020 | $5,310 | $160,370 | $39,410 | $120,960 |
| 2019 | $5,193 | $160,370 | $39,410 | $120,960 |
| 2018 | $5,258 | $159,530 | $39,410 | $120,120 |
| 2017 | $5,177 | $159,530 | $39,410 | $120,120 |
| 2016 | $5,028 | $159,530 | $39,410 | $120,120 |
| 2015 | $4,933 | $159,530 | $39,410 | $120,120 |
| 2014 | $4,861 | $159,530 | $39,410 | $120,120 |
Source: Public Records
Map
Nearby Homes