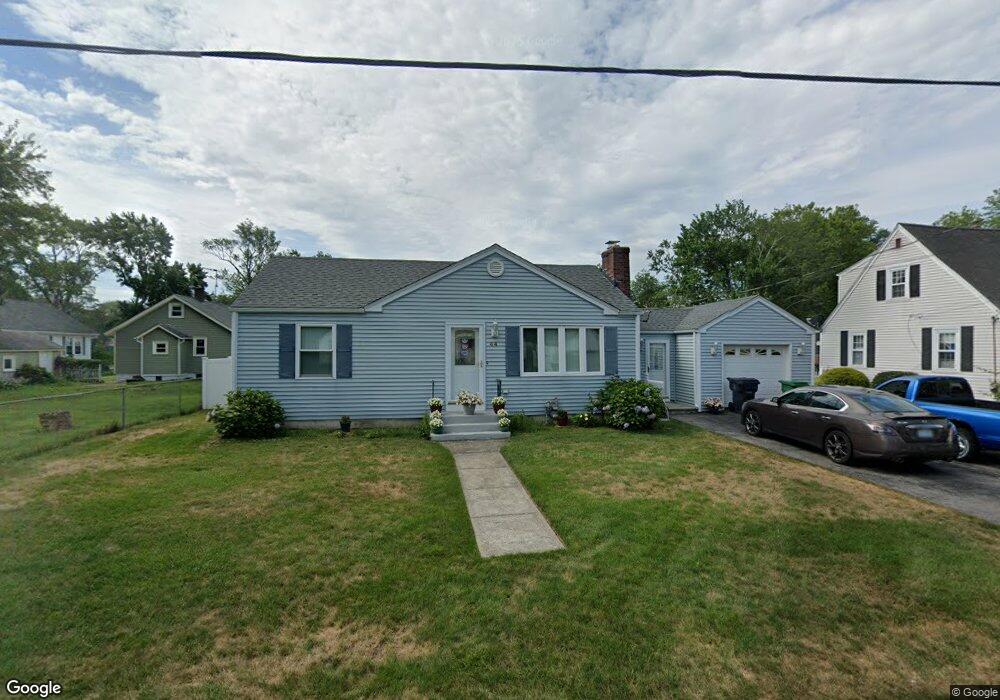
44 Ninigret St Warwick, RI 02889
Hoxie NeighborhoodEstimated Value: $332,000 - $379,000
2
Beds
1
Bath
1,386
Sq Ft
$263/Sq Ft
Est. Value
About This Home
This home is located at 44 Ninigret St, Warwick, RI 02889 and is currently estimated at $365,030, approximately $263 per square foot. 44 Ninigret St is a home located in Kent County with nearby schools including Saint Kevin School, St. Peter School, and Bishop Hendricken High School.
Ownership History
Date
Name
Owned For
Owner Type
Purchase Details
Closed on
Dec 16, 1997
Sold by
Hyink Paul A
Bought by
Parkhouse Cheryl A
Current Estimated Value
Create a Home Valuation Report for This Property
The Home Valuation Report is an in-depth analysis detailing your home's value as well as a comparison with similar homes in the area
Home Values in the Area
Average Home Value in this Area
Purchase History
| Date | Buyer | Sale Price | Title Company |
|---|---|---|---|
| Parkhouse Cheryl A | $80,000 | -- |
Source: Public Records
Mortgage History
| Date | Status | Borrower | Loan Amount |
|---|---|---|---|
| Open | Parkhouse Cheryl A | $100,100 | |
| Closed | Parkhouse Cheryl A | $51,200 | |
| Closed | Parkhouse Cheryl A | $40,000 | |
| Closed | Parkhouse Cheryl A | $25,000 |
Source: Public Records
Tax History Compared to Growth
Tax History
| Year | Tax Paid | Tax Assessment Tax Assessment Total Assessment is a certain percentage of the fair market value that is determined by local assessors to be the total taxable value of land and additions on the property. | Land | Improvement |
|---|---|---|---|---|
| 2025 | $4,178 | $329,000 | $104,000 | $225,000 |
| 2024 | $4,018 | $277,700 | $90,400 | $187,300 |
| 2023 | $3,941 | $277,700 | $90,400 | $187,300 |
| 2022 | $3,791 | $202,400 | $62,300 | $140,100 |
| 2021 | $3,791 | $202,400 | $62,300 | $140,100 |
| 2020 | $3,791 | $202,400 | $62,300 | $140,100 |
| 2019 | $3,791 | $202,400 | $62,300 | $140,100 |
| 2018 | $3,241 | $155,800 | $62,300 | $93,500 |
| 2017 | $3,137 | $155,000 | $62,300 | $92,700 |
| 2016 | $3,137 | $155,000 | $62,300 | $92,700 |
| 2015 | $2,876 | $138,600 | $54,800 | $83,800 |
| 2014 | $2,780 | $138,600 | $54,800 | $83,800 |
| 2013 | $2,743 | $138,600 | $54,800 | $83,800 |
Source: Public Records
Map
Nearby Homes
- 41 Recess Ln
- 72 W Shore Rd Unit 104
- 40 Cavalcade Blvd
- 161 W Shore Rd Unit B5
- 32 Omaha Blvd
- 33 Recess Ln
- 12 Lima St
- 52 Recess Ln
- 107 Glenwood Dr
- 33 Hargraves St
- 26 Dallas Ave
- 144 Hoxsie Ave
- 111 Aster St
- 58 Canna St
- 67 Brewster Dr
- 100 Aurora Dr
- 56 Partition St
- 40 Easton Ave
- 788 Namquid Dr
- 6 Black Creek Ln