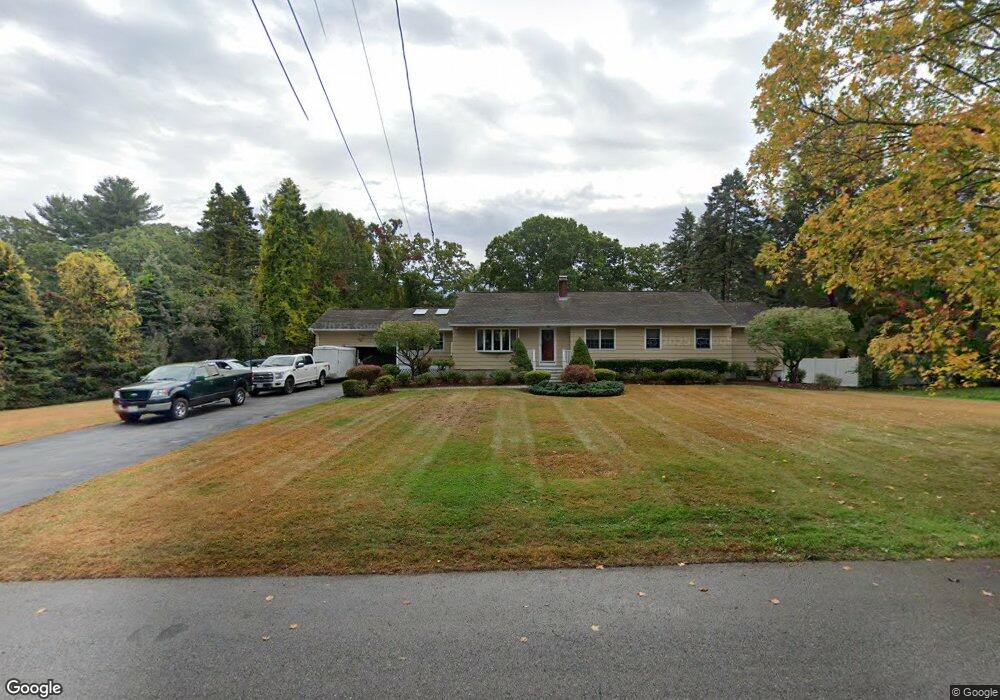
44 Oriole Dr Andover, MA 01810
West Andover NeighborhoodEstimated Value: $1,069,129 - $1,322,000
3
Beds
2
Baths
2,043
Sq Ft
$577/Sq Ft
Est. Value
About This Home
This home is located at 44 Oriole Dr, Andover, MA 01810 and is currently estimated at $1,178,532, approximately $576 per square foot. 44 Oriole Dr is a home located in Essex County with nearby schools including West Elementary School, Andover West Middle School, and Andover High School.
Ownership History
Date
Name
Owned For
Owner Type
Purchase Details
Closed on
Jun 30, 2003
Sold by
Partyka Angela M and Partyka Lawrence J
Bought by
Morgante Anthony M and Morgante Melissa
Current Estimated Value
Home Financials for this Owner
Home Financials are based on the most recent Mortgage that was taken out on this home.
Original Mortgage
$444,000
Interest Rate
5.53%
Mortgage Type
Purchase Money Mortgage
Purchase Details
Closed on
Feb 1, 1995
Sold by
Lewis Laurence R
Bought by
Partyka Lawrence J
Create a Home Valuation Report for This Property
The Home Valuation Report is an in-depth analysis detailing your home's value as well as a comparison with similar homes in the area
Home Values in the Area
Average Home Value in this Area
Purchase History
| Date | Buyer | Sale Price | Title Company |
|---|---|---|---|
| Morgante Anthony M | $555,000 | -- | |
| Partyka Lawrence J | $231,000 | -- |
Source: Public Records
Mortgage History
| Date | Status | Borrower | Loan Amount |
|---|---|---|---|
| Open | Partyka Lawrence J | $369,200 | |
| Closed | Partyka Lawrence J | $410,000 | |
| Closed | Morgante Anthony M | $444,000 | |
| Previous Owner | Partyka Lawrence J | $220,000 |
Source: Public Records
Tax History
| Year | Tax Paid | Tax Assessment Tax Assessment Total Assessment is a certain percentage of the fair market value that is determined by local assessors to be the total taxable value of land and additions on the property. | Land | Improvement |
|---|---|---|---|---|
| 2024 | $11,537 | $895,700 | $550,600 | $345,100 |
| 2023 | $11,044 | $808,500 | $495,800 | $312,700 |
| 2022 | $10,258 | $702,600 | $431,300 | $271,300 |
| 2021 | $9,685 | $633,400 | $392,100 | $241,300 |
| 2020 | $9,213 | $613,800 | $382,700 | $231,100 |
| 2019 | $8,776 | $574,700 | $349,600 | $225,100 |
| 2018 | $8,496 | $543,200 | $336,100 | $207,100 |
| 2017 | $8,120 | $534,900 | $329,600 | $205,300 |
| 2016 | $7,927 | $534,900 | $329,600 | $205,300 |
| 2015 | $7,642 | $510,500 | $316,900 | $193,600 |
Source: Public Records
Map
Nearby Homes
- 11 Rennie Dr
- 241 Lowell St Unit 3
- 1 Delisio Dr
- 6 Exeter Way
- 54 Birch Rd
- 105 Central St
- 37 Crenshaw Ln Unit 37
- 3 Caileigh Ct
- 31 Crenshaw Ln Unit 31
- 11 Cuba St
- 40 Chandler Cir
- 3 Torr St
- 20 Robert Dr Unit 20
- 12 Robert Dr Unit 12
- 25 Clubview Dr Unit 25
- 2 Powder Mill Square Unit 2B
- 1 Sweeney Ct
- 36 High St
- 96 N Main St Unit 3
- 100.5 Main St Unit Q
- 46 Oriole Dr
- 40 Oriole Dr
- 0000 Confidential
- 1 Confidential
- Lot 17 A Christian Way
- 45 Oriole Dr
- 43 Oriole Dr
- 97 Argilla Rd
- 104 Argilla Rd
- 102 Argilla Rd
- 34 Oriole Dr
- 108 Argilla Rd
- 39 Oriole Dr
- 100 Argilla Rd
- 95 Argilla Rd
- 111 Argilla Rd
- 36 Oriole Dr
- 112 Argilla Rd Unit 2
- 96 Argilla Rd
- 34 Wild Rose Dr
Your Personal Tour Guide
Ask me questions while you tour the home.