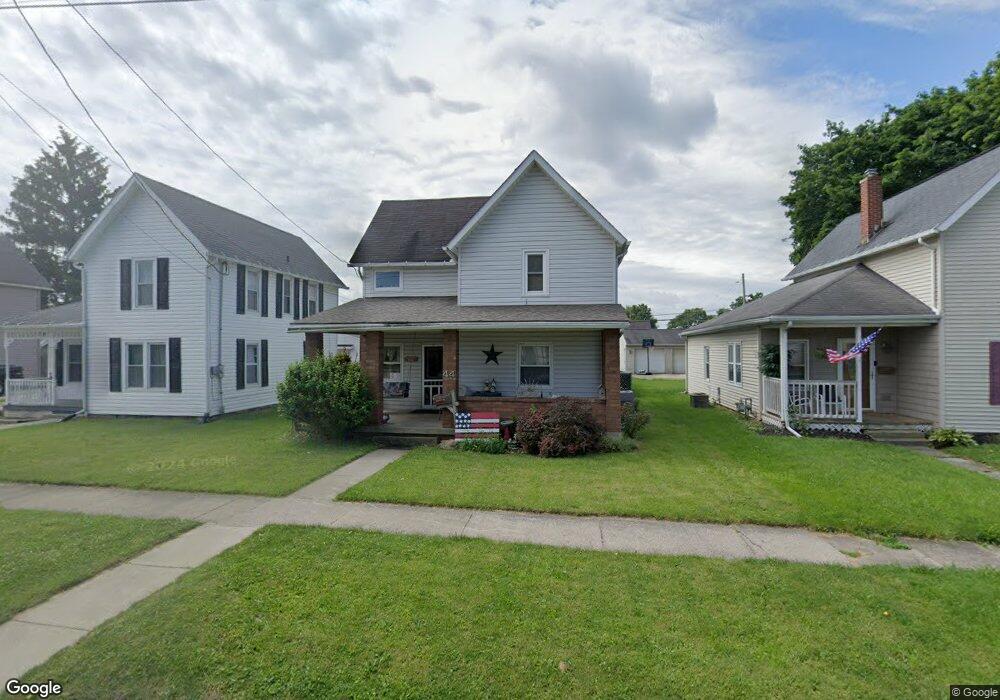
44 Raymond Ave Shelby, OH 44875
Estimated Value: $135,622 - $162,000
3
Beds
1
Bath
1,342
Sq Ft
$107/Sq Ft
Est. Value
About This Home
This home is located at 44 Raymond Ave, Shelby, OH 44875 and is currently estimated at $143,406, approximately $106 per square foot. 44 Raymond Ave is a home located in Richland County with nearby schools including St. Mary's School.
Ownership History
Date
Name
Owned For
Owner Type
Purchase Details
Closed on
Oct 7, 2013
Sold by
Abrams Steven P
Bought by
George Dee Dee
Current Estimated Value
Purchase Details
Closed on
Apr 13, 2009
Sold by
Evans Dee Dee George and George Todd Michael
Bought by
Abrams Steven P
Purchase Details
Closed on
Dec 5, 2008
Sold by
Freedom Estates Ltd
Bought by
Evans Dee Dee George and Abrams Steven P
Purchase Details
Closed on
Nov 25, 2008
Sold by
Secretary Of Housing & Urban Development
Bought by
Freedom Estates Ltd
Purchase Details
Closed on
Jul 2, 2007
Sold by
Hall Robert M
Bought by
Hud
Purchase Details
Closed on
Mar 31, 2006
Sold by
Hartz Bruce D and Hartz Angela L
Bought by
Hall Robert M
Home Financials for this Owner
Home Financials are based on the most recent Mortgage that was taken out on this home.
Original Mortgage
$3,595
Interest Rate
6.34%
Mortgage Type
Stand Alone Second
Purchase Details
Closed on
May 16, 1994
Sold by
Kuhn William E
Bought by
Hartz Bruce D
Create a Home Valuation Report for This Property
The Home Valuation Report is an in-depth analysis detailing your home's value as well as a comparison with similar homes in the area
Home Values in the Area
Average Home Value in this Area
Purchase History
| Date | Buyer | Sale Price | Title Company |
|---|---|---|---|
| George Dee Dee | $22,000 | Attorney | |
| Abrams Steven P | -- | Barrister Lawyers Title | |
| Evans Dee Dee George | $22,000 | Southern Title | |
| Freedom Estates Ltd | $6,500 | Lakeside Title | |
| Hud | $50,000 | None Available | |
| Hall Robert M | $92,500 | Landamerica Lawyers Title | |
| Hartz Bruce D | $53,000 | -- |
Source: Public Records
Mortgage History
| Date | Status | Borrower | Loan Amount |
|---|---|---|---|
| Previous Owner | Hall Robert M | $3,595 | |
| Previous Owner | Hall Robert M | $91,774 |
Source: Public Records
Tax History
| Year | Tax Paid | Tax Assessment Tax Assessment Total Assessment is a certain percentage of the fair market value that is determined by local assessors to be the total taxable value of land and additions on the property. | Land | Improvement |
|---|---|---|---|---|
| 2024 | $1,270 | $34,050 | $3,540 | $30,510 |
| 2023 | $1,302 | $34,050 | $3,540 | $30,510 |
| 2022 | $1,301 | $30,420 | $3,580 | $26,840 |
| 2021 | $1,301 | $30,420 | $3,580 | $26,840 |
| 2020 | $1,302 | $30,420 | $3,580 | $26,840 |
| 2019 | $1,211 | $25,940 | $3,030 | $22,910 |
| 2018 | $1,199 | $25,940 | $3,030 | $22,910 |
| 2017 | $1,181 | $25,940 | $3,030 | $22,910 |
| 2016 | $1,175 | $25,820 | $2,880 | $22,940 |
| 2015 | $1,175 | $25,820 | $2,880 | $22,940 |
| 2014 | $1,129 | $25,820 | $2,880 | $22,940 |
| 2012 | $1,161 | $27,170 | $3,030 | $24,140 |
Source: Public Records
Map
Nearby Homes
Your Personal Tour Guide
Ask me questions while you tour the home.