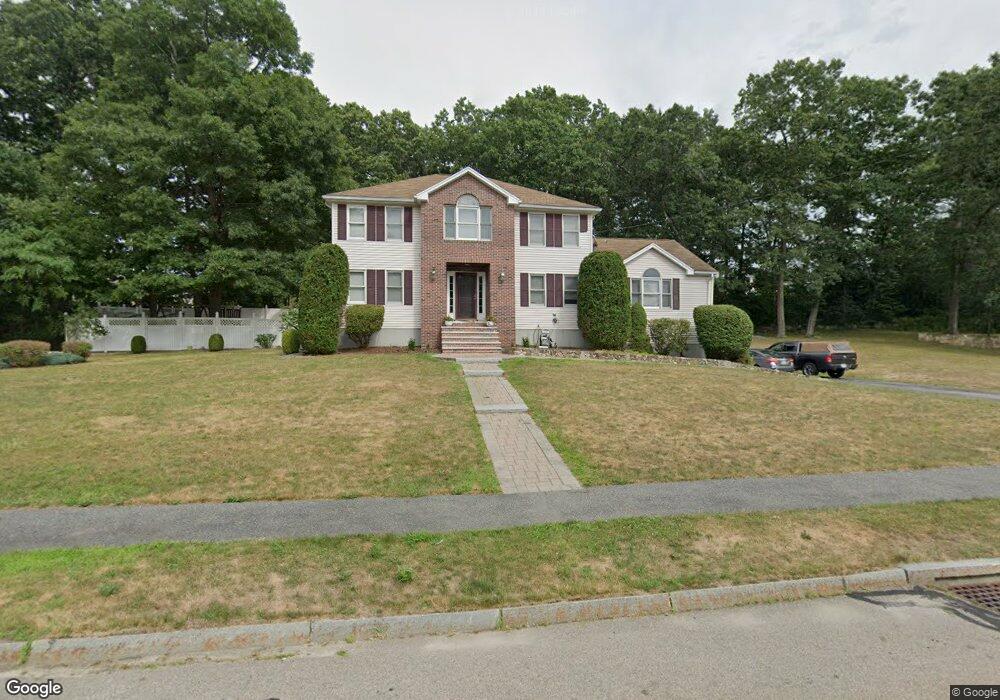
44 S Central St Milford, MA 01757
Estimated Value: $707,000 - $937,000
4
Beds
3
Baths
2,460
Sq Ft
$324/Sq Ft
Est. Value
About This Home
This home is located at 44 S Central St, Milford, MA 01757 and is currently estimated at $796,624, approximately $323 per square foot. 44 S Central St is a home located in Worcester County with nearby schools including Milford High School and Bethany Christian Academy.
Ownership History
Date
Name
Owned For
Owner Type
Purchase Details
Closed on
Jun 25, 2001
Sold by
Claffey George J and Claffey Karen A
Bought by
Morgan William F and Morgan Shannon
Current Estimated Value
Purchase Details
Closed on
Feb 21, 1997
Sold by
F&D Central Rt and Afonso Domingos
Bought by
Claffey George J and Semmel Karen A
Create a Home Valuation Report for This Property
The Home Valuation Report is an in-depth analysis detailing your home's value as well as a comparison with similar homes in the area
Home Values in the Area
Average Home Value in this Area
Purchase History
| Date | Buyer | Sale Price | Title Company |
|---|---|---|---|
| Morgan William F | $350,000 | -- | |
| Claffey George J | $230,000 | -- |
Source: Public Records
Mortgage History
| Date | Status | Borrower | Loan Amount |
|---|---|---|---|
| Open | Claffey George J | $240,000 | |
| Closed | Claffey George J | $32,500 | |
| Closed | Claffey George J | $250,000 |
Source: Public Records
Tax History
| Year | Tax Paid | Tax Assessment Tax Assessment Total Assessment is a certain percentage of the fair market value that is determined by local assessors to be the total taxable value of land and additions on the property. | Land | Improvement |
|---|---|---|---|---|
| 2025 | $9,236 | $721,600 | $226,900 | $494,700 |
| 2024 | $9,149 | $688,400 | $218,200 | $470,200 |
| 2023 | $8,544 | $591,300 | $181,200 | $410,100 |
| 2022 | $8,074 | $524,600 | $165,900 | $358,700 |
| 2021 | $7,706 | $482,200 | $165,900 | $316,300 |
| 2020 | $7,613 | $477,000 | $165,900 | $311,100 |
| 2019 | $7,407 | $447,800 | $165,900 | $281,900 |
| 2018 | $7,344 | $443,500 | $161,600 | $281,900 |
| 2017 | $7,079 | $421,600 | $161,600 | $260,000 |
| 2016 | $6,946 | $404,300 | $161,600 | $242,700 |
| 2015 | $6,774 | $386,000 | $161,600 | $224,400 |
Source: Public Records
Map
Nearby Homes
- 7 Howard St
- 10 Black Bear Unit 10
- 16 Black Bear Cir Unit 16
- 3 Black Bear Cir Unit 3
- 7 Black Bear Unit 7
- 9 Black Bear Cir Unit 9
- 11 Black Bear Unit 11
- 13 Black Bear Cir Unit 13
- 43 Black Bear Cir Unit 43
- 15 Black Bear Cir Unit 15
- 48 Black Bear Cir Unit 48
- 46 Black Bear Cir Unit 46
- 44 Black Bear Cir Unit 44
- 56 S Main St
- 6 Poplar St
- 40 Chestnut St
- 33 Chestnut St
- 56 S Bow St
- 7 Woodland Ct Unit B
- 35 Woodland Ave Unit 35A
Your Personal Tour Guide
Ask me questions while you tour the home.