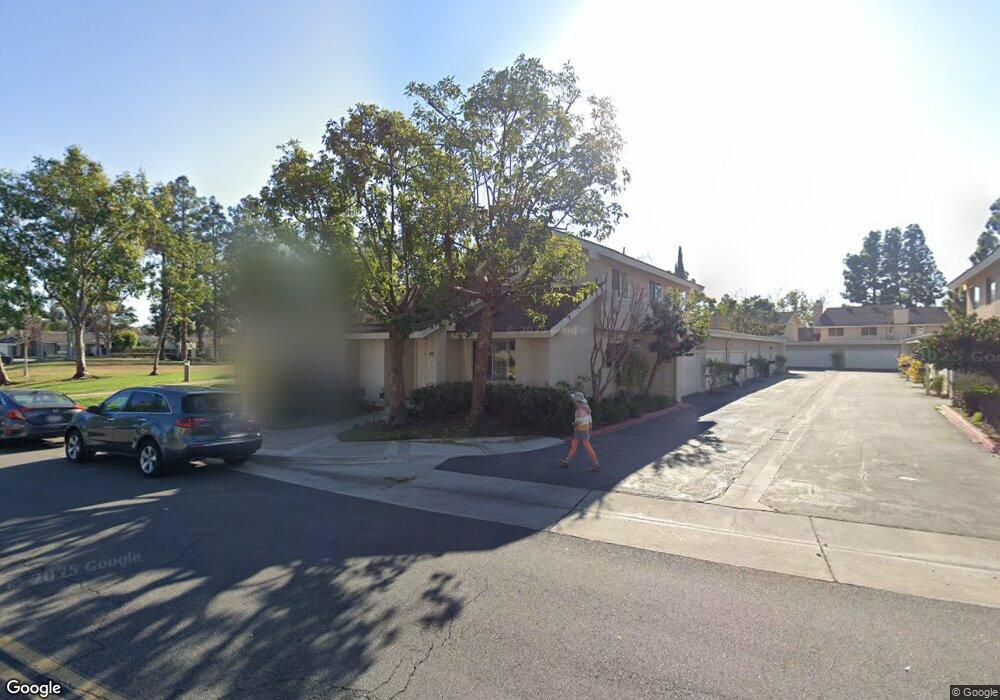
44 Snapdragon Unit 26 Irvine, CA 92604
Walnut NeighborhoodEstimated Value: $894,046 - $1,025,000
3
Beds
2
Baths
1,164
Sq Ft
$835/Sq Ft
Est. Value
About This Home
This home is located at 44 Snapdragon Unit 26, Irvine, CA 92604 and is currently estimated at $971,512, approximately $834 per square foot. 44 Snapdragon Unit 26 is a home located in Orange County with nearby schools including Deerfield Elementary School, Venado Middle School, and Irvine High School.
Ownership History
Date
Name
Owned For
Owner Type
Purchase Details
Closed on
Feb 9, 2015
Sold by
Montelone Sue Anne
Bought by
Montelone Sue Anne and Sue Anne Montelone Revocable Living Trus
Current Estimated Value
Purchase Details
Closed on
Feb 29, 2012
Sold by
Montelone Sue Anne and Montelone Robert L
Bought by
Montelone Sue Anne
Purchase Details
Closed on
Oct 4, 2011
Sold by
Montelone Sue Anne and Montelone Robert L
Bought by
Montelone Sue Anne
Home Financials for this Owner
Home Financials are based on the most recent Mortgage that was taken out on this home.
Original Mortgage
$212,000
Outstanding Balance
$20,116
Interest Rate
4.16%
Mortgage Type
New Conventional
Estimated Equity
$951,396
Purchase Details
Closed on
Apr 25, 1996
Sold by
Lilly Clarke N and Westphal Ruth M
Bought by
Mccullough Sue Anne
Home Financials for this Owner
Home Financials are based on the most recent Mortgage that was taken out on this home.
Original Mortgage
$129,300
Interest Rate
7.97%
Create a Home Valuation Report for This Property
The Home Valuation Report is an in-depth analysis detailing your home's value as well as a comparison with similar homes in the area
Home Values in the Area
Average Home Value in this Area
Purchase History
| Date | Buyer | Sale Price | Title Company |
|---|---|---|---|
| Montelone Sue Anne | -- | None Available | |
| Montelone Sue Anne | -- | First American Title Company | |
| Montelone Sue Anne | -- | First American Title Company | |
| Mccullough Sue Anne | $172,500 | Commonwealth Land Title |
Source: Public Records
Mortgage History
| Date | Status | Borrower | Loan Amount |
|---|---|---|---|
| Open | Montelone Sue Anne | $212,000 | |
| Closed | Mccullough Sue Anne | $129,300 |
Source: Public Records
Tax History Compared to Growth
Tax History
| Year | Tax Paid | Tax Assessment Tax Assessment Total Assessment is a certain percentage of the fair market value that is determined by local assessors to be the total taxable value of land and additions on the property. | Land | Improvement |
|---|---|---|---|---|
| 2025 | $3,119 | $286,554 | $120,441 | $166,113 |
| 2024 | $3,119 | $280,936 | $118,080 | $162,856 |
| 2023 | $3,038 | $275,428 | $115,765 | $159,663 |
| 2022 | $2,970 | $270,028 | $113,495 | $156,533 |
| 2021 | $2,900 | $264,734 | $111,270 | $153,464 |
| 2020 | $2,884 | $262,020 | $110,129 | $151,891 |
| 2019 | $2,820 | $256,883 | $107,970 | $148,913 |
| 2018 | $2,769 | $251,847 | $105,853 | $145,994 |
| 2017 | $2,712 | $246,909 | $103,777 | $143,132 |
| 2016 | $2,596 | $242,068 | $101,742 | $140,326 |
| 2015 | $2,558 | $238,432 | $100,213 | $138,219 |
| 2014 | $2,510 | $233,762 | $98,250 | $135,512 |
Source: Public Records
Map
Nearby Homes
- 14871 Pinehaven Rd
- 32 Goldenbush
- 15202 Marne Cir
- 4 Wintergreen Unit 4
- 15071 Talley St
- 8 Stonewood
- 26 Firebird Unit 69
- 22 Firebird Unit 71
- 3 Elmwood
- 36 Oakdale
- 14612 Highcrest Cir
- 14972 Geneva St
- 43 W Yale Loop Unit 29
- 20 Acorn Unit 21
- 15232 Lille Cir
- 16 E Yale Loop Unit 28
- 20 Sacramento Unit 10
- 5 Butterfly
- 45 Golden Glen St Unit 75
- 5291 Strasbourg Ave
- 42 Snapdragon Unit 27
- 42 Snapdragon
- 40 Snapdragon
- 46 Snapdragon
- 46 Snapdragon Unit 25
- 46 Snapdragon
- 9 Snapdragon Unit 5
- 9 Snapdragon
- 2 Snapdragon Unit 27
- 2 Snapdragon
- 8 Snapdragon Unit 24
- 6 Snapdragon Unit 25
- 6 Snapdragon
- 39 Snapdragon Unit 21
- 41 Snapdragon Unit 22
- 43 Snapdragon
- 11 Snapdragon
- 12 Snapdragon Unit 22
- 12 Snapdragon
- 45 Snapdragon