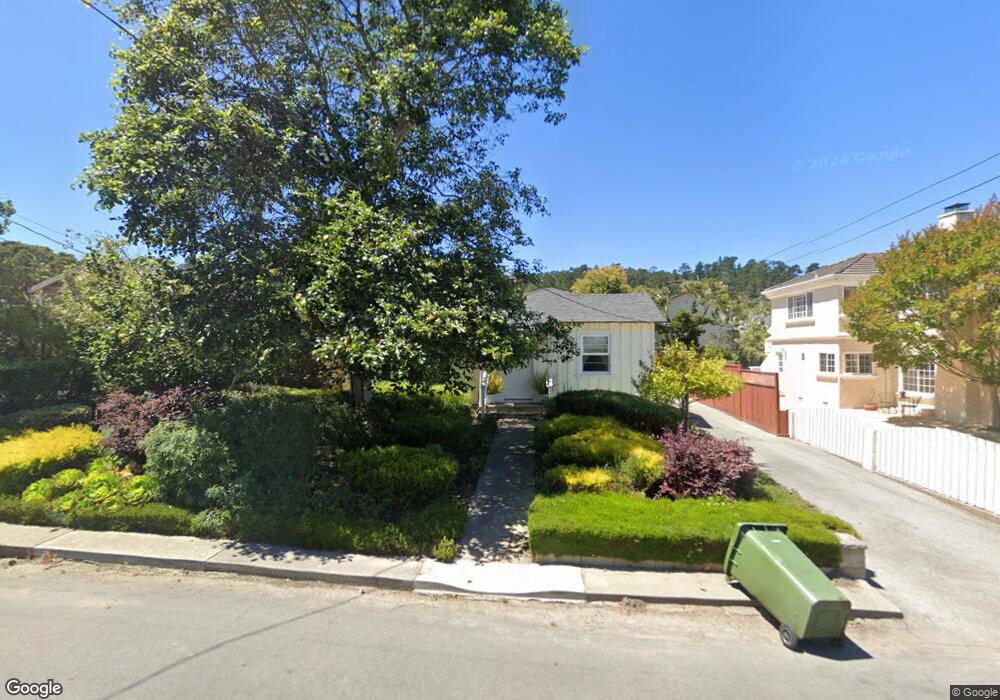
44 Via Chualar Monterey, CA 93940
Monterey Vista NeighborhoodEstimated Value: $1,276,536 - $1,475,000
2
Beds
2
Baths
1,734
Sq Ft
$796/Sq Ft
Est. Value
About This Home
This home is located at 44 Via Chualar, Monterey, CA 93940 and is currently estimated at $1,379,884, approximately $795 per square foot. 44 Via Chualar is a home located in Monterey County with nearby schools including Monte Vista Elementary School, Monte Vista Middle School, and Monterey High School.
Ownership History
Date
Name
Owned For
Owner Type
Purchase Details
Closed on
Aug 29, 2013
Sold by
Baker James F and Baker Karen I
Bought by
Baker James F and Baker Karen I
Current Estimated Value
Purchase Details
Closed on
Aug 7, 2013
Sold by
Baker James F and Baker Karen
Bought by
Baker James F and Baker Karen I
Create a Home Valuation Report for This Property
The Home Valuation Report is an in-depth analysis detailing your home's value as well as a comparison with similar homes in the area
Home Values in the Area
Average Home Value in this Area
Purchase History
| Date | Buyer | Sale Price | Title Company |
|---|---|---|---|
| Baker James F | -- | None Available | |
| Baker James F | -- | None Available |
Source: Public Records
Tax History Compared to Growth
Tax History
| Year | Tax Paid | Tax Assessment Tax Assessment Total Assessment is a certain percentage of the fair market value that is determined by local assessors to be the total taxable value of land and additions on the property. | Land | Improvement |
|---|---|---|---|---|
| 2025 | $3,775 | $345,536 | $146,412 | $199,124 |
| 2024 | $3,775 | $338,762 | $143,542 | $195,220 |
| 2023 | $3,622 | $332,121 | $140,728 | $191,393 |
| 2022 | $3,571 | $325,610 | $137,969 | $187,641 |
| 2021 | $3,518 | $319,226 | $135,264 | $183,962 |
| 2020 | $3,387 | $315,954 | $133,878 | $182,076 |
| 2019 | $3,548 | $309,759 | $131,253 | $178,506 |
| 2018 | $3,408 | $303,686 | $128,680 | $175,006 |
| 2017 | $3,159 | $297,732 | $126,157 | $171,575 |
| 2016 | $3,102 | $291,895 | $123,684 | $168,211 |
| 2015 | $3,057 | $287,512 | $121,827 | $165,685 |
| 2014 | $3,004 | $281,881 | $119,441 | $162,440 |
Source: Public Records
Map
Nearby Homes
- 140 Stephen Place
- 148 Stephen Place
- 6 Madison St
- 23 Cramden Dr
- 252 Soledad Dr
- 32 Via Ventura
- 443 Watson St
- 6 Huckleberry Ct
- 925 Cass St
- 182 El Dorado St
- 15 Pinehill Way
- 1034 Hellam St
- 120 Carmelito Ave
- 936 Wainwright St
- 70 Forest Ridge Rd Unit 22
- 5 Stratford Place
- 2308 Golden Oaks Ln
- 1210 Golden Oaks Ln
- 3104 Golden Oaks Ln
- 3309 Golden Oaks Ln