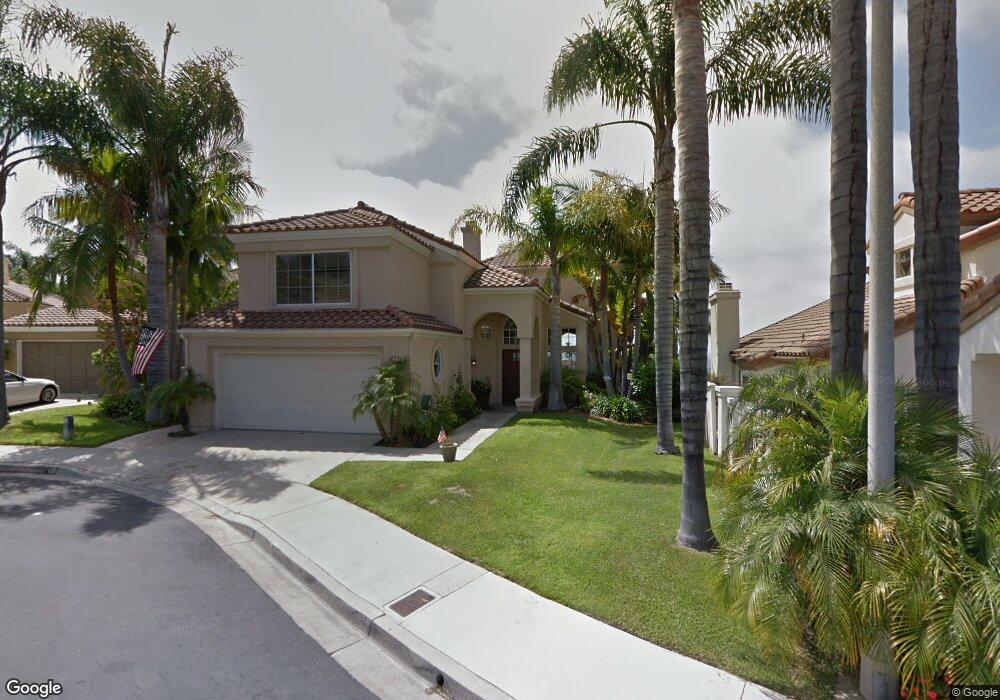
44 Via Zaragoza San Clemente, CA 92672
Rancho San Clemente NeighborhoodEstimated Value: $1,832,051 - $2,347,000
4
Beds
3
Baths
3,025
Sq Ft
$661/Sq Ft
Est. Value
About This Home
This home is located at 44 Via Zaragoza, San Clemente, CA 92672 and is currently estimated at $2,001,013, approximately $661 per square foot. 44 Via Zaragoza is a home located in Orange County with nearby schools including Clarence Lobo Elementary School, Bernice Ayer Middle School, and San Clemente High School.
Ownership History
Date
Name
Owned For
Owner Type
Purchase Details
Closed on
Mar 17, 2014
Sold by
Matson Kristen M
Bought by
Matson Daniel K
Current Estimated Value
Purchase Details
Closed on
Aug 5, 2001
Sold by
Matson Daniel K and Matson Kristen M
Bought by
Matson Daniel K and Matson Kristen M
Home Financials for this Owner
Home Financials are based on the most recent Mortgage that was taken out on this home.
Original Mortgage
$392,500
Interest Rate
7.19%
Purchase Details
Closed on
Mar 10, 1998
Sold by
Daniel Matson
Bought by
Matson Daniel K and Matson Kristen M
Home Financials for this Owner
Home Financials are based on the most recent Mortgage that was taken out on this home.
Original Mortgage
$351,000
Interest Rate
6.5%
Purchase Details
Closed on
Mar 6, 1995
Sold by
Matson Daniel K
Bought by
Matson Daniel K and The Daniel Matson Trust
Purchase Details
Closed on
Jun 23, 1994
Sold by
Matson Daniel K and Matson Daniel
Bought by
Matson Daniel K
Create a Home Valuation Report for This Property
The Home Valuation Report is an in-depth analysis detailing your home's value as well as a comparison with similar homes in the area
Home Values in the Area
Average Home Value in this Area
Purchase History
| Date | Buyer | Sale Price | Title Company |
|---|---|---|---|
| Matson Daniel K | -- | None Available | |
| Matson Daniel K | -- | First Southwestern Title Co | |
| Matson Daniel K | -- | United Title Company | |
| Matson Daniel K | -- | United Title Company | |
| Matson Daniel K | -- | -- |
Source: Public Records
Mortgage History
| Date | Status | Borrower | Loan Amount |
|---|---|---|---|
| Closed | Matson Daniel K | $392,500 | |
| Closed | Matson Daniel K | $351,000 |
Source: Public Records
Tax History
| Year | Tax Paid | Tax Assessment Tax Assessment Total Assessment is a certain percentage of the fair market value that is determined by local assessors to be the total taxable value of land and additions on the property. | Land | Improvement |
|---|---|---|---|---|
| 2025 | $8,478 | $859,884 | $450,931 | $408,953 |
| 2024 | $8,478 | $843,024 | $442,089 | $400,935 |
| 2023 | $8,298 | $826,495 | $433,421 | $393,074 |
| 2022 | $8,138 | $810,290 | $424,923 | $385,367 |
| 2021 | $7,980 | $794,402 | $416,591 | $377,811 |
| 2020 | $7,900 | $786,257 | $412,319 | $373,938 |
| 2019 | $7,743 | $770,841 | $404,235 | $366,606 |
| 2018 | $7,593 | $755,727 | $396,309 | $359,418 |
| 2017 | $7,444 | $740,909 | $388,538 | $352,371 |
| 2016 | $7,300 | $726,382 | $380,920 | $345,462 |
| 2015 | $7,189 | $715,472 | $375,199 | $340,273 |
| 2014 | $7,050 | $701,457 | $367,849 | $333,608 |
Source: Public Records
Map
Nearby Homes
- 231 Via Presa Unit 84
- 304 La Fremontia
- 815 Calle Dulcinea
- 715 Calle Monserrat
- 801 Via Presa
- 615 Del Dios
- 716 Avenida Columbo
- 786 Avenida Salvador
- 803 Futura
- 1046 Calle Del Cerro
- 802 Avenida Presidio
- 27 Burriana
- 1048 Calle Del Cerro Unit 508
- 1052 Calle Del Cerro Unit 705
- 857 Avenida Acapulco
- 6 Puerto Royal
- 1064 Calle Del Cerro Unit 1304
- 1074 Calle Del Cerro Unit 1806
- 1068 Calle Del Cerro Unit 1506
- 606 E Avenida San Juan
- 46 Via Zaragoza
- 42 Via Zaragoza
- 48 Via Zaragoza
- 40 Via Zaragoza
- 50 Via Zaragoza
- 40 Paseo Alba
- 38 Paseo Alba
- 52 Via Zaragoza
- 36 Paseo Alba
- 49 Via Zaragoza
- 34 Paseo Alba
- 51 Via Zaragoza
- 32 Paseo Alba
- 44 Paseo Alba
- 53 Via Zaragoza
- 54 Via Zaragoza
- 30 Paseo Alba
- 64 Via Santa Maria
- 48 Paseo Alba
- 66 Via Santa Maria
Your Personal Tour Guide
Ask me questions while you tour the home.