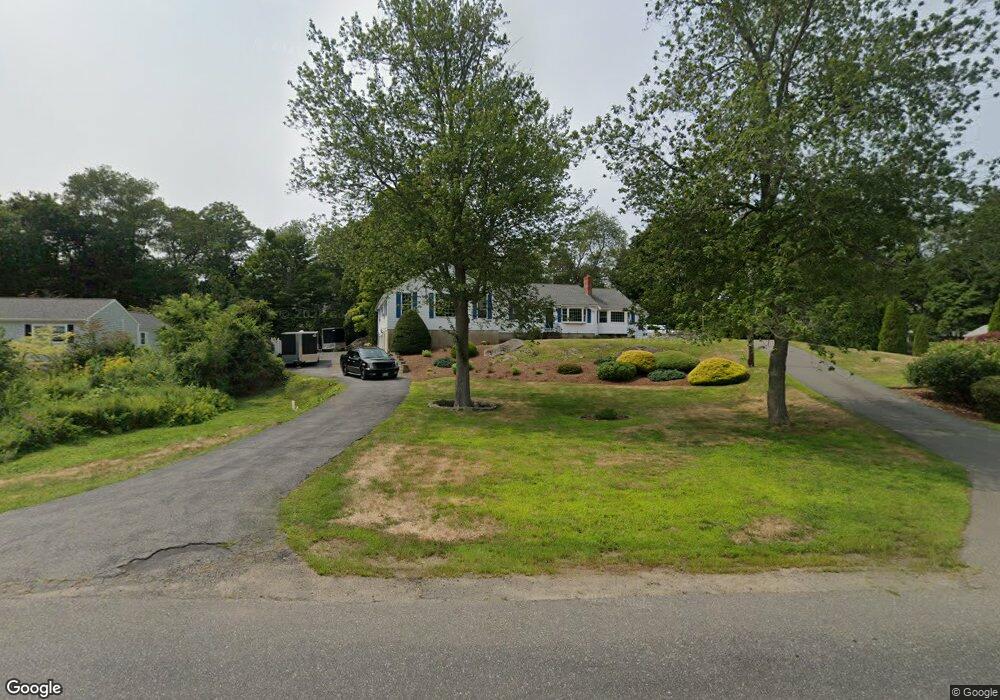
44 Wenham St Danvers, MA 01923
Estimated Value: $924,141 - $1,112,000
3
Beds
3
Baths
4,027
Sq Ft
$255/Sq Ft
Est. Value
About This Home
This home is located at 44 Wenham St, Danvers, MA 01923 and is currently estimated at $1,027,535, approximately $255 per square foot. 44 Wenham St is a home located in Essex County with nearby schools including Danvers High School, St. Mary of the Annunciation School, and St. John's Prep.
Ownership History
Date
Name
Owned For
Owner Type
Purchase Details
Closed on
Apr 30, 2021
Sold by
Goldych Gina A
Bought by
Goldych-Walters Gina and Walters Roger A
Current Estimated Value
Home Financials for this Owner
Home Financials are based on the most recent Mortgage that was taken out on this home.
Original Mortgage
$354,000
Outstanding Balance
$264,466
Interest Rate
3.1%
Mortgage Type
Stand Alone Refi Refinance Of Original Loan
Estimated Equity
$763,069
Purchase Details
Closed on
Nov 14, 2011
Sold by
Griffin David A and Griffin Janice M
Bought by
Goldych Gina A
Home Financials for this Owner
Home Financials are based on the most recent Mortgage that was taken out on this home.
Original Mortgage
$435,310
Interest Rate
4.01%
Mortgage Type
Purchase Money Mortgage
Create a Home Valuation Report for This Property
The Home Valuation Report is an in-depth analysis detailing your home's value as well as a comparison with similar homes in the area
Home Values in the Area
Average Home Value in this Area
Purchase History
| Date | Buyer | Sale Price | Title Company |
|---|---|---|---|
| Goldych-Walters Gina | -- | None Available | |
| Goldych-Walters Gina | -- | None Available | |
| Goldych-Walters Gina | -- | None Available | |
| Goldych Gina A | $447,000 | -- | |
| Goldych Gina A | $447,000 | -- | |
| Goldych Gina A | $447,000 | -- |
Source: Public Records
Mortgage History
| Date | Status | Borrower | Loan Amount |
|---|---|---|---|
| Open | Goldych-Walters Gina | $354,000 | |
| Closed | Goldych-Walters Gina | $354,000 | |
| Previous Owner | Goldych Gina A | $435,310 | |
| Previous Owner | Goldych Gina A | $25,000 |
Source: Public Records
Tax History
| Year | Tax Paid | Tax Assessment Tax Assessment Total Assessment is a certain percentage of the fair market value that is determined by local assessors to be the total taxable value of land and additions on the property. | Land | Improvement |
|---|---|---|---|---|
| 2025 | $8,873 | $807,400 | $399,800 | $407,600 |
| 2024 | $8,914 | $802,300 | $399,800 | $402,500 |
| 2023 | $8,542 | $727,000 | $354,600 | $372,400 |
| 2022 | $8,183 | $646,400 | $309,600 | $336,800 |
| 2021 | $7,503 | $562,000 | $281,100 | $280,900 |
| 2020 | $7,786 | $596,200 | $272,100 | $324,100 |
| 2019 | $7,798 | $587,200 | $263,100 | $324,100 |
| 2018 | $7,358 | $543,400 | $255,600 | $287,800 |
| 2017 | $7,393 | $521,000 | $237,600 | $283,400 |
| 2016 | $7,042 | $495,900 | $227,100 | $268,800 |
| 2015 | $6,625 | $444,300 | $197,100 | $247,200 |
Source: Public Records
Map
Nearby Homes
Your Personal Tour Guide
Ask me questions while you tour the home.