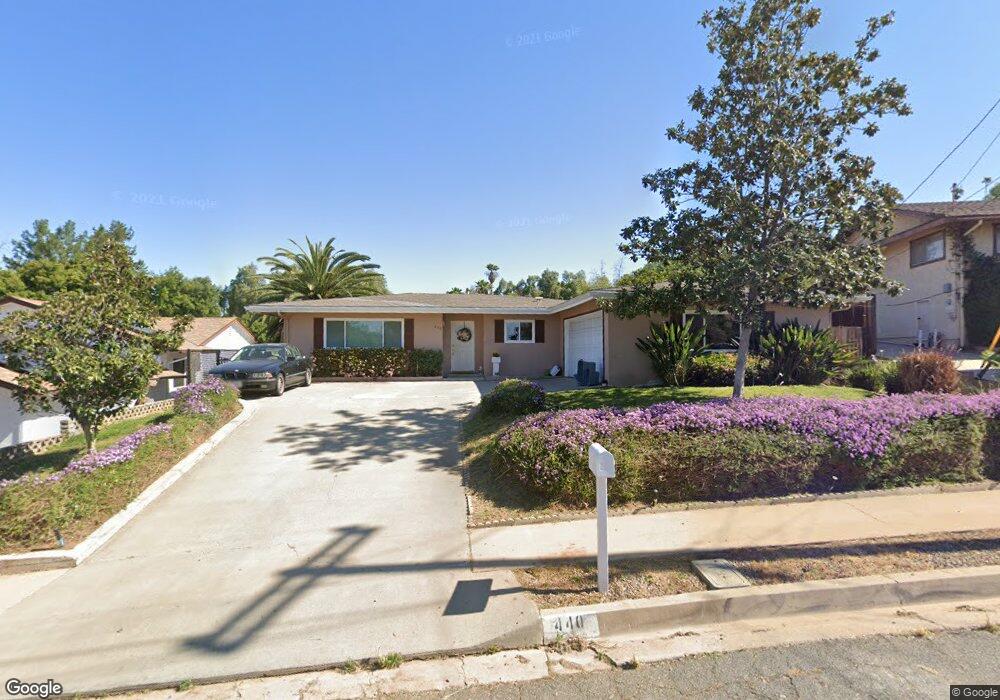
440 Chestnut Ln Escondido, CA 92025
Central Escondido NeighborhoodEstimated Value: $678,667 - $824,000
2
Beds
2
Baths
1,305
Sq Ft
$580/Sq Ft
Est. Value
About This Home
This home is located at 440 Chestnut Ln, Escondido, CA 92025 and is currently estimated at $756,417, approximately $579 per square foot. 440 Chestnut Ln is a home located in San Diego County with nearby schools including Juniper Elementary School, Bear Valley Middle School, and Orange Glen High School.
Ownership History
Date
Name
Owned For
Owner Type
Purchase Details
Closed on
Jul 18, 2014
Sold by
Smith Elisabeth
Bought by
Defari Smith Trust and Smith Larry G
Current Estimated Value
Purchase Details
Closed on
Nov 1, 1996
Sold by
Smith Elisabeth Deferari
Bought by
Smith Elisabeth Deferari
Home Financials for this Owner
Home Financials are based on the most recent Mortgage that was taken out on this home.
Original Mortgage
$80,500
Outstanding Balance
$7,404
Interest Rate
8.11%
Estimated Equity
$749,013
Purchase Details
Closed on
Oct 8, 1996
Sold by
Hancock Dorothy M and Thompson Eileen H
Bought by
Smith Elisabeth Deferari
Home Financials for this Owner
Home Financials are based on the most recent Mortgage that was taken out on this home.
Original Mortgage
$80,500
Outstanding Balance
$7,404
Interest Rate
8.11%
Estimated Equity
$749,013
Purchase Details
Closed on
Apr 25, 1995
Sold by
Hancock Dorothy M
Bought by
Hancock Dorothy M and Thompson Eileen H
Create a Home Valuation Report for This Property
The Home Valuation Report is an in-depth analysis detailing your home's value as well as a comparison with similar homes in the area
Home Values in the Area
Average Home Value in this Area
Purchase History
| Date | Buyer | Sale Price | Title Company |
|---|---|---|---|
| Defari Smith Trust | -- | None Available | |
| Smith Elisabeth Deferari | -- | -- | |
| Smith Elisabeth Deferari | $115,000 | California Coast Title | |
| Smith Elisabeth Deferari | -- | California Coast Title | |
| Hancock Dorothy M | -- | -- |
Source: Public Records
Mortgage History
| Date | Status | Borrower | Loan Amount |
|---|---|---|---|
| Open | Smith Elisabeth Deferari | $80,500 |
Source: Public Records
Tax History Compared to Growth
Tax History
| Year | Tax Paid | Tax Assessment Tax Assessment Total Assessment is a certain percentage of the fair market value that is determined by local assessors to be the total taxable value of land and additions on the property. | Land | Improvement |
|---|---|---|---|---|
| 2025 | $2,126 | $187,268 | $65,349 | $121,919 |
| 2024 | $2,126 | $183,597 | $64,068 | $119,529 |
| 2023 | $2,078 | $179,998 | $62,812 | $117,186 |
| 2022 | $2,055 | $176,470 | $61,581 | $114,889 |
| 2021 | $2,023 | $173,011 | $60,374 | $112,637 |
| 2020 | $2,011 | $171,238 | $59,755 | $111,483 |
| 2019 | $1,963 | $167,882 | $58,584 | $109,298 |
| 2018 | $1,909 | $164,591 | $57,436 | $107,155 |
| 2017 | $1,878 | $161,364 | $56,310 | $105,054 |
| 2016 | $1,841 | $158,201 | $55,206 | $102,995 |
| 2015 | $1,826 | $155,825 | $54,377 | $101,448 |
| 2014 | $1,752 | $152,773 | $53,312 | $99,461 |
Source: Public Records
Map
Nearby Homes
- 1190 Robertson Dr
- 1421 Rincon Rd
- 123 E 11th Ave
- 1651 S Juniper St Unit 32
- 1651 S Juniper St Unit 110
- 1651 S Juniper St Unit 217
- 1651 S Juniper St Unit 10
- 1651 S Juniper St Unit 195
- 118 W 11th Ave
- 1550 S Maple St Unit 8
- 700 S Juniper St
- 1800 S Juniper St
- 118 W 8th Ave
- 340 W 15th Ave Unit 5
- 1654 Palomino Ln
- 1116 Circle Dr Unit 230-452-12-00
- 406-26 S Grape St
- 439 Eldorado Dr
- 320 W 8th Ave
- 806 E 4th Ave Unit 7
- 434 Chestnut Ln
- 444 Chestnut Ln
- 430 Chestnut Ln
- 450 Chestnut Ln
- 1321 Rincon Rd
- 1082 Rincon Rd
- 439 Chestnut Ln
- 443 Chestnut Ln
- 426 Chestnut Ln
- 1325 Rincon Rd
- 1331 Rincon Rd
- 454 Chestnut Ln
- 449 Chestnut Ln
- 422 Chestnut Ln
- 1315 Rincon Rd
- 1315 Rincon Rd
- 1317 Rincon Rd
- 1377 Rincon Rd
- 380 Idaho Ave
- 460 Chestnut Ln