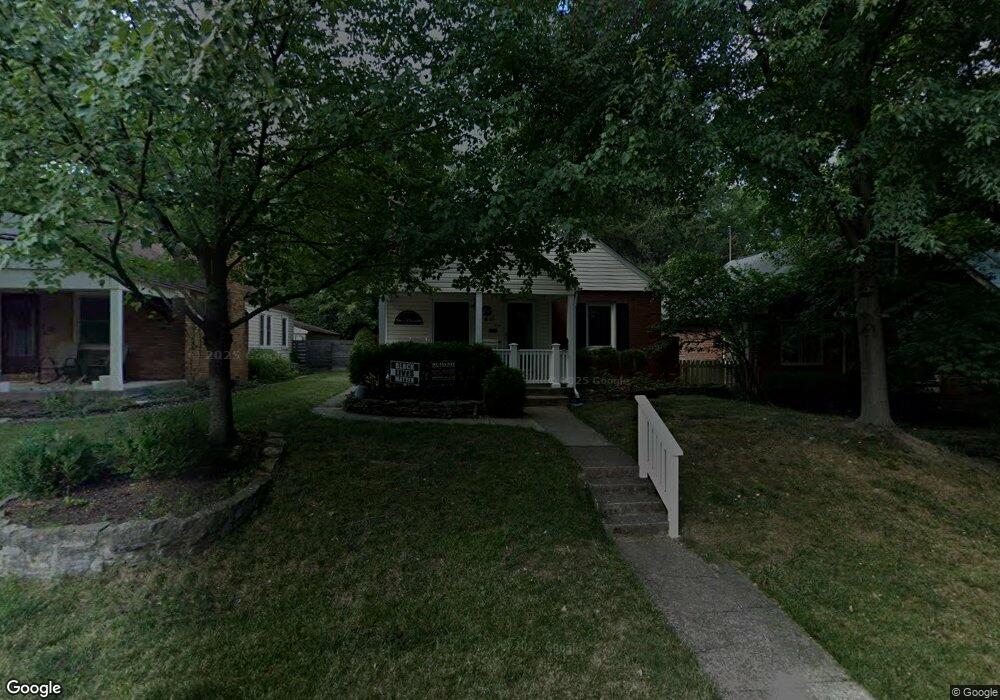
440 E Como Ave Columbus, OH 43202
Clintonville NeighborhoodEstimated Value: $369,000 - $432,000
3
Beds
2
Baths
1,173
Sq Ft
$339/Sq Ft
Est. Value
About This Home
This home is located at 440 E Como Ave, Columbus, OH 43202 and is currently estimated at $397,321, approximately $338 per square foot. 440 E Como Ave is a home located in Franklin County with nearby schools including Clinton Elementary School, Dominion Middle School, and Whetstone High School.
Ownership History
Date
Name
Owned For
Owner Type
Purchase Details
Closed on
Dec 12, 2008
Sold by
Price Bret M
Bought by
Sharer Allison K
Current Estimated Value
Home Financials for this Owner
Home Financials are based on the most recent Mortgage that was taken out on this home.
Original Mortgage
$155,200
Outstanding Balance
$101,712
Interest Rate
6.3%
Mortgage Type
Purchase Money Mortgage
Estimated Equity
$295,609
Purchase Details
Closed on
Apr 27, 2001
Sold by
Frankart Stefani J and Frankart Stefani J
Bought by
Price Bret M
Home Financials for this Owner
Home Financials are based on the most recent Mortgage that was taken out on this home.
Original Mortgage
$136,923
Interest Rate
6.62%
Mortgage Type
VA
Purchase Details
Closed on
May 22, 1997
Sold by
Hoser Russell R and Hoser Kimberly Lahmon
Bought by
Frankart Stefani J
Home Financials for this Owner
Home Financials are based on the most recent Mortgage that was taken out on this home.
Original Mortgage
$85,500
Interest Rate
7.75%
Purchase Details
Closed on
Mar 31, 1992
Purchase Details
Closed on
Jun 1, 1986
Create a Home Valuation Report for This Property
The Home Valuation Report is an in-depth analysis detailing your home's value as well as a comparison with similar homes in the area
Home Values in the Area
Average Home Value in this Area
Purchase History
| Date | Buyer | Sale Price | Title Company |
|---|---|---|---|
| Sharer Allison K | $194,000 | Valmer Land | |
| Price Bret M | $142,000 | Chicago Title | |
| Frankart Stefani J | $106,900 | Connor Title Co | |
| -- | $87,500 | -- | |
| -- | $63,300 | -- |
Source: Public Records
Mortgage History
| Date | Status | Borrower | Loan Amount |
|---|---|---|---|
| Open | Sharer Allison K | $155,200 | |
| Previous Owner | Price Bret M | $136,923 | |
| Previous Owner | Frankart Stefani J | $85,500 |
Source: Public Records
Tax History
| Year | Tax Paid | Tax Assessment Tax Assessment Total Assessment is a certain percentage of the fair market value that is determined by local assessors to be the total taxable value of land and additions on the property. | Land | Improvement |
|---|---|---|---|---|
| 2025 | $4,502 | $100,320 | $37,350 | $62,970 |
| 2024 | $4,502 | $100,320 | $37,350 | $62,970 |
| 2023 | $4,445 | $100,310 | $37,345 | $62,965 |
| 2022 | $4,397 | $84,770 | $27,580 | $57,190 |
| 2021 | $4,404 | $84,770 | $27,580 | $57,190 |
| 2020 | $4,410 | $84,770 | $27,580 | $57,190 |
| 2019 | $3,958 | $65,240 | $21,210 | $44,030 |
| 2018 | $3,923 | $65,240 | $21,210 | $44,030 |
| 2017 | $3,955 | $65,240 | $21,210 | $44,030 |
| 2016 | $4,292 | $64,790 | $19,740 | $45,050 |
| 2015 | $3,896 | $64,790 | $19,740 | $45,050 |
| 2014 | $3,906 | $64,790 | $19,740 | $45,050 |
| 2013 | $1,898 | $63,840 | $18,795 | $45,045 |
Source: Public Records
Map
Nearby Homes
- 534 Walhalla Rd
- 589 Clinton Heights Ave
- 296 Walhalla Rd
- 612 E Como Ave
- 555 E Weber Rd
- 544 Piedmont Rd
- 2836-2838 Indianola Ave Unit 2836
- 759 E Longview Ave
- 467 Brevoort Rd
- 76 E Lakeview Ave
- 580 Crestview Rd
- 83 Clinton Heights Ave
- 796 E Kenworth Rd
- 61 Tibet Rd
- 45 E California Ave
- 528 Arden Rd
- 3021 N High St
- 2733 Beulah Rd
- 44 W Pacemont Rd
- 3035 Audubon Rd
- 434 E Como Ave
- 444 E Como Ave
- 430 E Como Ave
- 450 E Como Ave
- 456 E Como Ave
- 424 E Como Ave
- 420 E Como Ave
- 460 E Como Ave
- 437 E Como Ave
- 441 E Como Ave
- 455 Walhalla Rd
- 431 E Como Ave
- 0 Walhalla Rd
- 425 E Como Ave
- 447 E Como Ave
- 443 Walhalla Rd
- 414 E Como Ave
- 466 E Como Ave
- 421 E Como Ave
- 453 E Como Ave
Your Personal Tour Guide
Ask me questions while you tour the home.