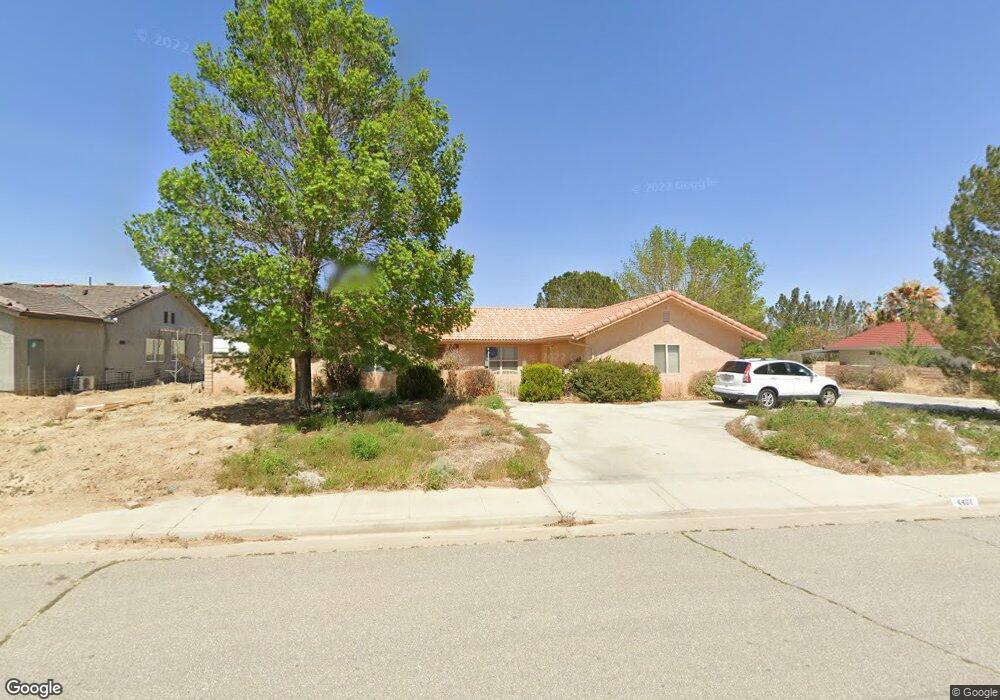
4401 Stetson Ave Rosamond, CA 93560
Estimated Value: $468,000 - $808,000
4
Beds
2
Baths
1,639
Sq Ft
$361/Sq Ft
Est. Value
About This Home
This home is located at 4401 Stetson Ave, Rosamond, CA 93560 and is currently estimated at $591,711, approximately $361 per square foot. 4401 Stetson Ave is a home located in Kern County.
Ownership History
Date
Name
Owned For
Owner Type
Purchase Details
Closed on
Aug 22, 2013
Sold by
Wilder Suzanne M
Bought by
Wilder Bruce J
Current Estimated Value
Purchase Details
Closed on
Jun 15, 2013
Sold by
Roth John E and Roth Sylvia D
Bought by
Wilder Bruce J
Home Financials for this Owner
Home Financials are based on the most recent Mortgage that was taken out on this home.
Original Mortgage
$210,000
Interest Rate
4.33%
Mortgage Type
New Conventional
Purchase Details
Closed on
Mar 18, 2011
Sold by
Roth John E and Roth Sylvia D
Bought by
Roth John E and Roth Sylvia D
Purchase Details
Closed on
Mar 24, 2009
Sold by
Roth John Edward
Bought by
John E Roth Living Trust
Purchase Details
Closed on
Jan 21, 2000
Sold by
Skypark Llc
Bought by
Roth John Edward
Create a Home Valuation Report for This Property
The Home Valuation Report is an in-depth analysis detailing your home's value as well as a comparison with similar homes in the area
Home Values in the Area
Average Home Value in this Area
Purchase History
| Date | Buyer | Sale Price | Title Company |
|---|---|---|---|
| Wilder Bruce J | -- | Old Republic Title Company | |
| Wilder Bruce J | $360,000 | Old Republic Title Company | |
| Roth John E | -- | None Available | |
| Roth John E | -- | None Available | |
| Roth John E | -- | None Available | |
| John E Roth Living Trust | -- | None Available | |
| Roth John Edward | $36,500 | Chicago Title Insurance |
Source: Public Records
Mortgage History
| Date | Status | Borrower | Loan Amount |
|---|---|---|---|
| Previous Owner | Wilder Bruce J | $210,000 |
Source: Public Records
Tax History Compared to Growth
Tax History
| Year | Tax Paid | Tax Assessment Tax Assessment Total Assessment is a certain percentage of the fair market value that is determined by local assessors to be the total taxable value of land and additions on the property. | Land | Improvement |
|---|---|---|---|---|
| 2025 | $6,542 | $441,299 | $183,874 | $257,425 |
| 2024 | $6,406 | $432,647 | $180,269 | $252,378 |
| 2023 | $6,406 | $424,165 | $176,735 | $247,430 |
| 2022 | $6,211 | $415,849 | $173,270 | $242,579 |
| 2021 | $6,033 | $407,696 | $169,873 | $237,823 |
| 2020 | $5,906 | $403,517 | $168,132 | $235,385 |
| 2019 | $5,008 | $403,517 | $168,132 | $235,385 |
| 2018 | $4,867 | $387,850 | $161,604 | $226,246 |
| 2017 | $4,783 | $380,246 | $158,436 | $221,810 |
| 2016 | $4,561 | $372,791 | $155,330 | $217,461 |
| 2015 | $4,618 | $367,192 | $152,997 | $214,195 |
| 2014 | $4,648 | $360,000 | $150,000 | $210,000 |
Source: Public Records
Map
Nearby Homes
- 4209 W Rosamond Blvd Unit 73
- 6081 Felsite Ave
- 4500 W Rosamond Blvd Unit 21
- 0 Stetson Ave Unit ND25224969
- 4010 Stetson Ave
- 4800 W Rosamond Blvd
- 50 St. Rosamond Blvd
- 3300 156th St W
- 0 Felsite Unit 24005805
- 0 Felsite Unit CV25047192
- 0 Felsite Unit 24005806
- 0 Felsite Unit 530057
- 0 Felsite Unit 24005808
- 0 Felsite Unit 25005543
- 0 Vic 45th St W and Truman Rd Unit 25007530
- 3823 45th St W
- 0 Rosamond Blvd & Parkview 48th Unit 25008869
- 3719 Santa Ynez Ct
- 4851 Truman Rd
- 50 W North East Corner Rosamond Blvd
- 4381 Stetson Ave
- 4421 Stetson Ave
- 4361 Stetson Ave
- 4441 Stetson Ave
- 4400 Stetson Ave
- 4390 Stetson Ave
- 4380 Stetson Ave
- 4370 Stetson Ave
- 4341 Stetson Ave
- 4461 Stetson Ave
- 4360 Stetson Ave
- 4400 Knox Ave
- 4420 Knox Ave
- 4391 Silverado Ct
- 4381 Silverado Ct
- 4321 Stetson Ave
- 4371 Silverado Ct
- 4360 Knox Ave
- 4440 Knox Ave
- 3211 Airway Ln