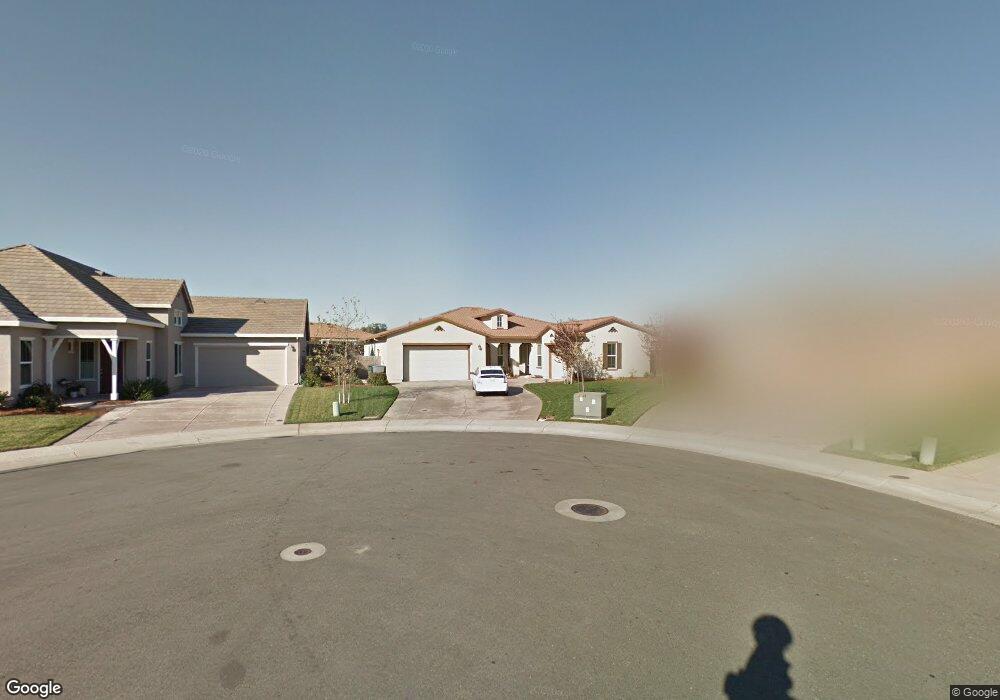
4404 Pike Ct Redding, CA 96002
South Bechelli NeighborhoodEstimated Value: $524,000 - $635,000
4
Beds
3
Baths
2,869
Sq Ft
$202/Sq Ft
Est. Value
About This Home
This home is located at 4404 Pike Ct, Redding, CA 96002 and is currently estimated at $579,228, approximately $201 per square foot. 4404 Pike Ct is a home located in Shasta County with nearby schools including Lassen View Elementary School, Parsons Junior High School, and Enterprise High School.
Ownership History
Date
Name
Owned For
Owner Type
Purchase Details
Closed on
Jun 28, 2021
Sold by
Singh Jaspal
Bought by
Dhami Gurvir and Gill Sukhvir Kaur
Current Estimated Value
Home Financials for this Owner
Home Financials are based on the most recent Mortgage that was taken out on this home.
Original Mortgage
$400,000
Outstanding Balance
$362,938
Interest Rate
2.9%
Mortgage Type
New Conventional
Estimated Equity
$216,290
Purchase Details
Closed on
Apr 15, 2013
Sold by
Kaur Danjit and Kaur Daljit
Bought by
Singh Jaspal
Home Financials for this Owner
Home Financials are based on the most recent Mortgage that was taken out on this home.
Original Mortgage
$299,600
Interest Rate
3.5%
Mortgage Type
New Conventional
Purchase Details
Closed on
Mar 30, 2009
Sold by
Kaur Danjit
Bought by
Singh Jaspal
Home Financials for this Owner
Home Financials are based on the most recent Mortgage that was taken out on this home.
Original Mortgage
$318,400
Interest Rate
5.04%
Mortgage Type
Purchase Money Mortgage
Create a Home Valuation Report for This Property
The Home Valuation Report is an in-depth analysis detailing your home's value as well as a comparison with similar homes in the area
Home Values in the Area
Average Home Value in this Area
Purchase History
| Date | Buyer | Sale Price | Title Company |
|---|---|---|---|
| Dhami Gurvir | $500,000 | Fidelity Natl Ttl Co Of Ca | |
| Singh Jaspal | -- | Servicelink | |
| Singh Jaspal | -- | Fidelity National Title Co | |
| Singh Jaspal | $398,000 | Fidelity National Title Co |
Source: Public Records
Mortgage History
| Date | Status | Borrower | Loan Amount |
|---|---|---|---|
| Open | Dhami Gurvir | $400,000 | |
| Previous Owner | Singh Jaspal | $299,600 | |
| Previous Owner | Singh Jaspal | $318,400 |
Source: Public Records
Tax History
| Year | Tax Paid | Tax Assessment Tax Assessment Total Assessment is a certain percentage of the fair market value that is determined by local assessors to be the total taxable value of land and additions on the property. | Land | Improvement |
|---|---|---|---|---|
| 2025 | $7,518 | $671,106 | $81,181 | $589,925 |
| 2024 | $7,406 | $657,948 | $79,590 | $578,358 |
| 2023 | $7,406 | $645,048 | $78,030 | $567,018 |
| 2022 | $7,194 | $632,400 | $76,500 | $555,900 |
| 2021 | $5,380 | $473,485 | $95,169 | $378,316 |
| 2020 | $5,305 | $468,631 | $94,194 | $374,437 |
| 2019 | $5,068 | $450,000 | $85,000 | $365,000 |
| 2018 | $4,800 | $426,000 | $85,000 | $341,000 |
| 2017 | $5,163 | $426,000 | $85,000 | $341,000 |
| 2016 | $4,678 | $404,000 | $80,000 | $324,000 |
| 2015 | $4,547 | $400,000 | $80,000 | $320,000 |
| 2014 | $4,426 | $390,000 | $75,000 | $315,000 |
Source: Public Records
Map
Nearby Homes
- 723 Woodacre Dr
- 4323 Churn Crk Rd
- 3857 Eagle Pkwy
- 5367 Rosswood Ln
- 3708 Traverse St
- 688 Julie Way
- 4302 Paulson Ln
- 3500 Pioneer Ln
- 3232 Nicolet Ln
- 3703 Harrow Ct
- 2940 Felstet Ln
- 3527 Adams Ln
- 99999 Churn Creek Rd
- 1209 C St
- 1106 2nd St
- 1513 Harpole Rd
- 5855 Live Oak Ln
- 952 Camino Ct
- 3428 Adams Ln
- 1108 4th St
- 4488 Pike Ct
- 4401 Pike Ct
- 655 Rivercrest Pkwy
- 643 Rivercrest Pkwy
- 667 Rivercrest Pkwy
- 4455 Egret Ct
- 4431 Pike Ct
- 631 Rivercrest Pkwy
- 4492 Pike Ct
- 4538 Chinook Dr
- 4495 Egret Ct
- 679 Rivercrest Pkwy
- 18979 Rivercrest Pkwy
- 19005 Rivercrest Pkwy
- 4498 Chinook Dr
- 619 Rivercrest Pkwy
- 4564 Chinook Dr
- 652 Rivercrest Pkwy
- 642 Rivercrest Pkwy
- 705 Rivercrest Pkwy
Your Personal Tour Guide
Ask me questions while you tour the home.