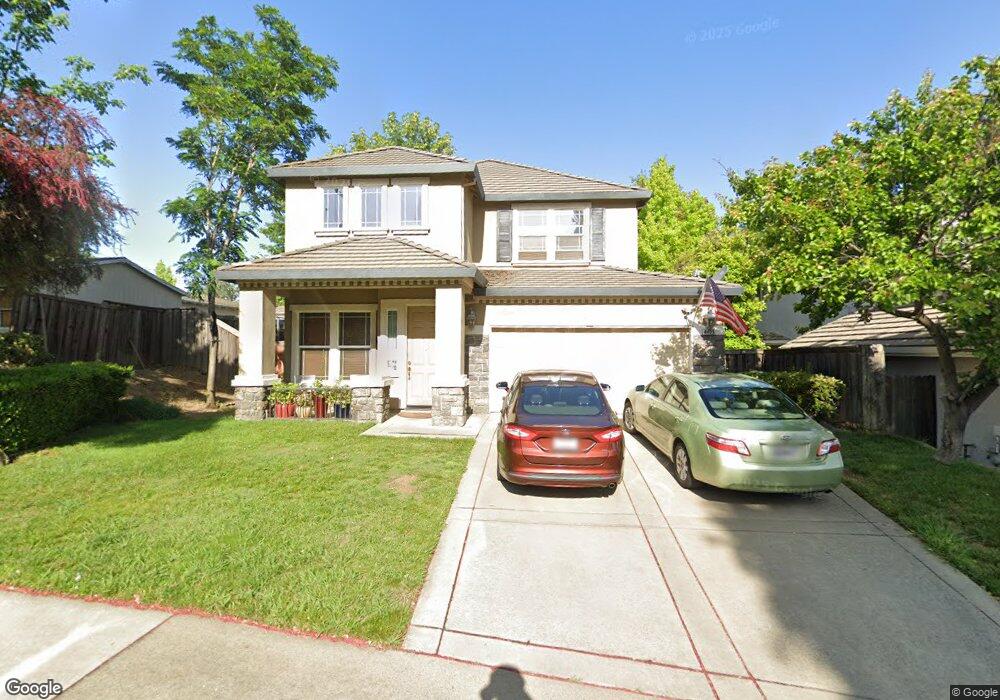
4405 Bijan Ct Fair Oaks, CA 95628
Estimated Value: $696,000 - $866,000
4
Beds
3
Baths
2,955
Sq Ft
$272/Sq Ft
Est. Value
About This Home
This home is located at 4405 Bijan Ct, Fair Oaks, CA 95628 and is currently estimated at $805,147, approximately $272 per square foot. 4405 Bijan Ct is a home located in Sacramento County with nearby schools including Northridge Elementary School, Andrew Carnegie Middle School, and Bella Vista High School.
Ownership History
Date
Name
Owned For
Owner Type
Purchase Details
Closed on
Mar 12, 2003
Sold by
Sunset West Executive Communities Inc
Bought by
Meros David C and Lendenmann Meros Rosemarie
Current Estimated Value
Home Financials for this Owner
Home Financials are based on the most recent Mortgage that was taken out on this home.
Original Mortgage
$130,000
Outstanding Balance
$55,683
Interest Rate
5.83%
Estimated Equity
$749,464
Purchase Details
Closed on
Oct 18, 2002
Sold by
Mitchell Gary R and Mitchell Cynthia A
Bought by
Sunset West Executive Communities Inc
Home Financials for this Owner
Home Financials are based on the most recent Mortgage that was taken out on this home.
Original Mortgage
$200,000
Interest Rate
6.09%
Mortgage Type
Construction
Purchase Details
Closed on
Apr 10, 2002
Sold by
Purewal Paul
Bought by
Mitchell Gary R and Mitchell Cynthia A
Create a Home Valuation Report for This Property
The Home Valuation Report is an in-depth analysis detailing your home's value as well as a comparison with similar homes in the area
Home Values in the Area
Average Home Value in this Area
Purchase History
| Date | Buyer | Sale Price | Title Company |
|---|---|---|---|
| Meros David C | $439,000 | Placer Title Company | |
| Sunset West Executive Communities Inc | -- | Placer Title Company | |
| Mitchell Gary R | $119,000 | Fidelity National Title Co |
Source: Public Records
Mortgage History
| Date | Status | Borrower | Loan Amount |
|---|---|---|---|
| Open | Meros David C | $130,000 | |
| Previous Owner | Sunset West Executive Communities Inc | $200,000 |
Source: Public Records
Tax History Compared to Growth
Tax History
| Year | Tax Paid | Tax Assessment Tax Assessment Total Assessment is a certain percentage of the fair market value that is determined by local assessors to be the total taxable value of land and additions on the property. | Land | Improvement |
|---|---|---|---|---|
| 2025 | $7,674 | $635,795 | $172,339 | $463,456 |
| 2024 | $7,674 | $623,329 | $168,960 | $454,369 |
| 2023 | $7,451 | $611,108 | $165,648 | $445,460 |
| 2022 | $7,424 | $599,126 | $162,400 | $436,726 |
| 2021 | $7,281 | $587,379 | $159,216 | $428,163 |
| 2020 | $7,177 | $581,357 | $157,584 | $423,773 |
| 2019 | $6,996 | $569,959 | $154,495 | $415,464 |
| 2018 | $6,842 | $558,784 | $151,466 | $407,318 |
| 2017 | $6,775 | $547,829 | $148,497 | $399,332 |
| 2016 | $6,006 | $509,362 | $127,340 | $382,022 |
| 2015 | $5,765 | $489,772 | $122,443 | $367,329 |
| 2014 | $5,644 | $480,168 | $120,042 | $360,126 |
Source: Public Records
Map
Nearby Homes
- 10236 Fair Oaks Blvd
- 7930 Orange Ave
- 7932 Orange Ave
- 7940 Orange Ave
- 7938 Orange Ave
- 7934 Orange Ave
- 8004 Archer Ave
- 4342 Central Ave
- 7649 Ridge St
- 8005 Livorna Way
- 4079 Bridge St
- 8065 Livorna Way
- 7969 Glenbar Way
- 8011 Glenbar Way
- 8117 Shangrila Dr
- 4516 Sierra View Way
- 4712 Medford St
- 4516 New York Ave
- 4433 New York Ave
- 0 Ridge St Unit 225129517
- 4409 Bijan Ct
- 4401 Bijan Ct
- 7991 Old Winding Way
- 4413 Bijan Ct
- 4423 Bijan Ct
- 4404 Bijan Ct
- 4427 Bijan Ct
- 4400 Bijan Ct
- 4408 Bijan Ct
- 7987 Old Winding Way
- 4419 Bijan Ct
- 7996 Old Winding Way
- 4412 Bijan Ct
- 4344 Vintage Oaks Ln
- 4431 Bijan Ct
- 4416 Bijan Ct
- 4435 Bijan Ct
- 7965 Old Winding Way
- 4420 Bijan Ct
- 7969 Old Winding Way