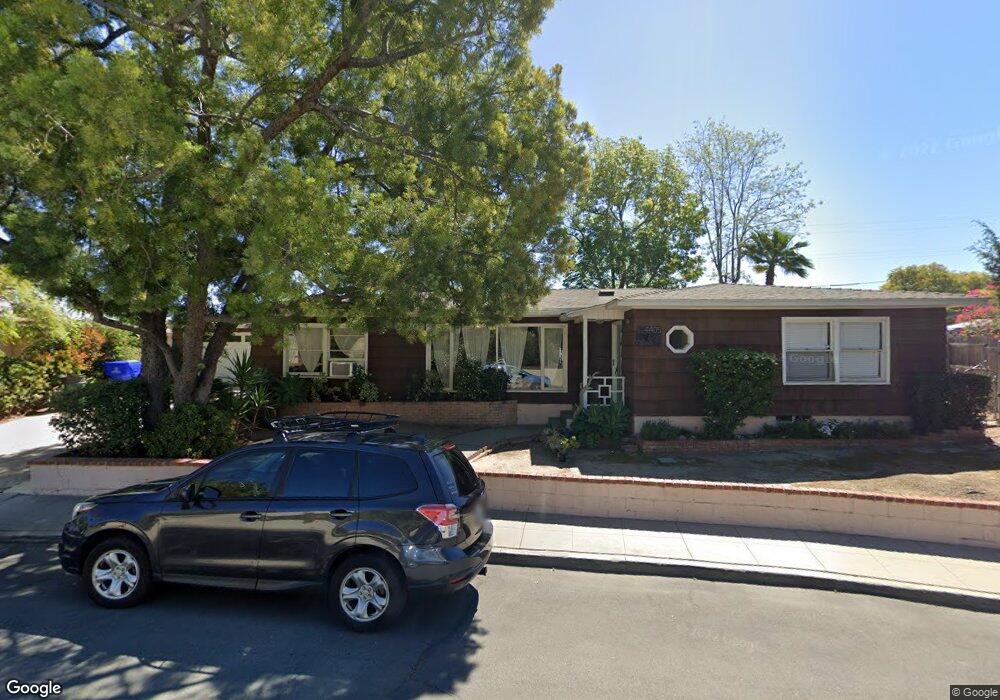
4405 Mataro Dr San Diego, CA 92115
Rolando NeighborhoodEstimated Value: $937,000 - $1,029,000
3
Beds
2
Baths
1,938
Sq Ft
$501/Sq Ft
Est. Value
About This Home
This home is located at 4405 Mataro Dr, San Diego, CA 92115 and is currently estimated at $971,762, approximately $501 per square foot. 4405 Mataro Dr is a home located in San Diego County with nearby schools including Clay Elementary School, Mann Middle School, and Crawford High School.
Ownership History
Date
Name
Owned For
Owner Type
Purchase Details
Closed on
Feb 19, 2015
Sold by
Ohnesorgen George Wolfe and Ohnesorgen Erika Renae
Bought by
Op Family Trust and Ohnesorgen Erika Renae
Current Estimated Value
Home Financials for this Owner
Home Financials are based on the most recent Mortgage that was taken out on this home.
Original Mortgage
$352,000
Outstanding Balance
$268,004
Interest Rate
3.6%
Mortgage Type
New Conventional
Estimated Equity
$703,758
Purchase Details
Closed on
Nov 25, 2014
Sold by
Ohnesorgen George and Ohnesorgen Erika R
Bought by
Ohnesorgen George Wolfe and Ohenesorgen Erika Rose
Purchase Details
Closed on
Sep 3, 2009
Sold by
Martinson Remette
Bought by
Ohnesorgen George and Ohnesorgen Erika R
Home Financials for this Owner
Home Financials are based on the most recent Mortgage that was taken out on this home.
Original Mortgage
$280,321
Interest Rate
5.2%
Mortgage Type
FHA
Purchase Details
Closed on
May 7, 2003
Sold by
Busch Vilda
Bought by
Busch Vilda
Create a Home Valuation Report for This Property
The Home Valuation Report is an in-depth analysis detailing your home's value as well as a comparison with similar homes in the area
Home Values in the Area
Average Home Value in this Area
Purchase History
| Date | Buyer | Sale Price | Title Company |
|---|---|---|---|
| Op Family Trust | -- | Ticor Title | |
| Ohnesorgen George Wolfe | -- | None Available | |
| Ohnesorgen George | $290,000 | Chicago Title Company | |
| Busch Vilda | -- | -- |
Source: Public Records
Mortgage History
| Date | Status | Borrower | Loan Amount |
|---|---|---|---|
| Open | Op Family Trust | $352,000 | |
| Closed | Ohnesorgen George | $280,321 |
Source: Public Records
Tax History Compared to Growth
Tax History
| Year | Tax Paid | Tax Assessment Tax Assessment Total Assessment is a certain percentage of the fair market value that is determined by local assessors to be the total taxable value of land and additions on the property. | Land | Improvement |
|---|---|---|---|---|
| 2025 | $4,560 | $374,321 | $97,892 | $276,429 |
| 2024 | $4,560 | $366,982 | $95,973 | $271,009 |
| 2023 | $4,458 | $359,788 | $94,092 | $265,696 |
| 2022 | $4,339 | $352,735 | $92,248 | $260,487 |
| 2021 | $4,309 | $345,820 | $90,440 | $255,380 |
| 2020 | $4,257 | $342,275 | $89,513 | $252,762 |
| 2019 | $4,182 | $335,564 | $87,758 | $247,806 |
| 2018 | $3,911 | $328,986 | $86,038 | $242,948 |
| 2017 | $3,818 | $322,536 | $84,351 | $238,185 |
| 2016 | $3,756 | $316,213 | $82,698 | $233,515 |
| 2015 | $3,701 | $311,464 | $81,456 | $230,008 |
| 2014 | $3,644 | $305,364 | $79,861 | $225,503 |
Source: Public Records
Map
Nearby Homes
- 4411 Mataro Dr
- 6628 Malcolm Dr
- 4401 Mataro Dr
- 6634 Malcolm Dr
- 6620 Malcolm Dr
- 4417 Mataro Dr
- 4410 Mataro Dr
- 4404 Alamo Dr
- 6602 Malcolm Dr
- 4418 Mataro Dr
- 4416 Alamo Dr
- 4421 Mataro Dr
- 4386 Aragon Dr
- 4420 Alamo Dr
- 4370 Alamo Dr
- 6621 Malcolm Dr
- 4426 Mataro Dr
- 4395 Aragon Way
- 4413 Aragon Dr
- 4429 Mataro Dr