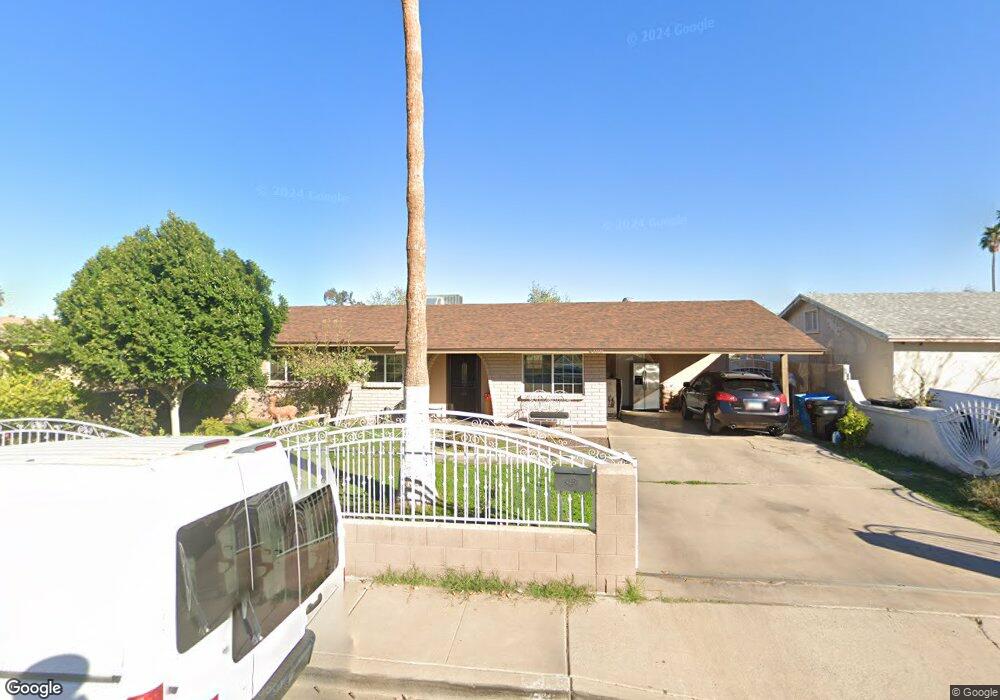
4408 W Encanto Blvd Phoenix, AZ 85035
Maryvale NeighborhoodEstimated Value: $255,795 - $325,000
--
Bed
2
Baths
984
Sq Ft
$308/Sq Ft
Est. Value
About This Home
This home is located at 4408 W Encanto Blvd, Phoenix, AZ 85035 and is currently estimated at $303,199, approximately $308 per square foot. 4408 W Encanto Blvd is a home located in Maricopa County with nearby schools including Joseph Zito Elementary School, Maryvale High School, and Phoenix Coding Academy.
Ownership History
Date
Name
Owned For
Owner Type
Purchase Details
Closed on
Dec 1, 2015
Sold by
Olguin Alicia Bonfil
Bought by
Olsguin Alicia Bonfil and Llamoca Rolando Aucca
Current Estimated Value
Purchase Details
Closed on
Nov 13, 2014
Sold by
Rodriguez Jose Luis
Bought by
Olguin Alicia Bonfil
Purchase Details
Closed on
Nov 15, 2011
Sold by
Atlas Residential Llc
Bought by
Rodriguez Jose Luis and Olguin Alicia Bonfil
Purchase Details
Closed on
Oct 20, 2011
Sold by
Nunez Nancy Guadalupe
Bought by
Atlas Residential Llc
Purchase Details
Closed on
Oct 7, 2005
Sold by
Nunez Danny Esparza
Bought by
Nunez Nancy Guadalupe
Home Financials for this Owner
Home Financials are based on the most recent Mortgage that was taken out on this home.
Original Mortgage
$114,400
Interest Rate
7.37%
Mortgage Type
Purchase Money Mortgage
Create a Home Valuation Report for This Property
The Home Valuation Report is an in-depth analysis detailing your home's value as well as a comparison with similar homes in the area
Home Values in the Area
Average Home Value in this Area
Purchase History
| Date | Buyer | Sale Price | Title Company |
|---|---|---|---|
| Olsguin Alicia Bonfil | -- | None Available | |
| Olguin Alicia Bonfil | -- | None Available | |
| Rodriguez Jose Luis | -- | None Available | |
| Atlas Residential Llc | $22,688 | None Available | |
| Nunez Nancy Guadalupe | $143,000 | Camelback Title Agency Llc |
Source: Public Records
Mortgage History
| Date | Status | Borrower | Loan Amount |
|---|---|---|---|
| Previous Owner | Nunez Nancy Guadalupe | $114,400 | |
| Closed | Nunez Nancy Guadalupe | $28,600 |
Source: Public Records
Tax History Compared to Growth
Tax History
| Year | Tax Paid | Tax Assessment Tax Assessment Total Assessment is a certain percentage of the fair market value that is determined by local assessors to be the total taxable value of land and additions on the property. | Land | Improvement |
|---|---|---|---|---|
| 2025 | $709 | $4,365 | -- | -- |
| 2024 | $697 | $4,157 | -- | -- |
| 2023 | $697 | $20,300 | $4,060 | $16,240 |
| 2022 | $665 | $15,820 | $3,160 | $12,660 |
| 2021 | $663 | $13,370 | $2,670 | $10,700 |
| 2020 | $651 | $12,000 | $2,400 | $9,600 |
| 2019 | $639 | $10,250 | $2,050 | $8,200 |
| 2018 | $641 | $9,170 | $1,830 | $7,340 |
| 2017 | $637 | $7,460 | $1,490 | $5,970 |
| 2016 | $617 | $6,360 | $1,270 | $5,090 |
| 2015 | $571 | $4,830 | $960 | $3,870 |
Source: Public Records
Map
Nearby Homes
- 4430 W Vernon Ave
- 4401 W Lewis Ave
- 2674 N 43rd Ave Unit D
- 2646 N 43rd Ave Unit B
- 2652 N 43rd Ave Unit C
- 2690 N 43rd Ave Unit D
- 4625 W Thomas Rd Unit 90
- 4625 W Thomas Rd Unit 57
- 4625 W Thomas Rd Unit 48
- 4007 W Holly St
- 2847 N 46th Ave Unit 10
- 3946 W Holly St
- 2846 N 46th Ave Unit 3
- 4744 W Holly St
- 3952 W Hubbell St
- 2511 N 48th Dr
- 4338 W Thomas Rd
- 3914 W Palm Ln Unit 5
- 2720 N 40th Ave
- 4823 W Palm Ln
- 4402 W Encanto Blvd
- 4414 W Encanto Blvd
- 4409 W Vernon Ave
- 4415 W Vernon Ave
- 4401 W Vernon Ave
- 4418 W Encanto Blvd
- 4348 W Encanto Blvd
- 4421 W Vernon Ave
- 4345 W Vernon Ave
- 4342 W Encanto Blvd
- 4424 W Encanto Blvd
- 4427 W Vernon Ave
- 4339 W Vernon Ave
- 4426 W Vernon Ave
- 4426 W Vernon Ave Unit 2
- 4336 W Encanto Blvd
- 4430 W Encanto Blvd
- 4420 W Vernon Ave
- 4434 W Vernon Ave
- 4414 W Vernon Ave