4409 216th Place SE Bothell, WA 98021
Canyon Creek NeighborhoodEstimated Value: $1,504,000 - $1,562,000
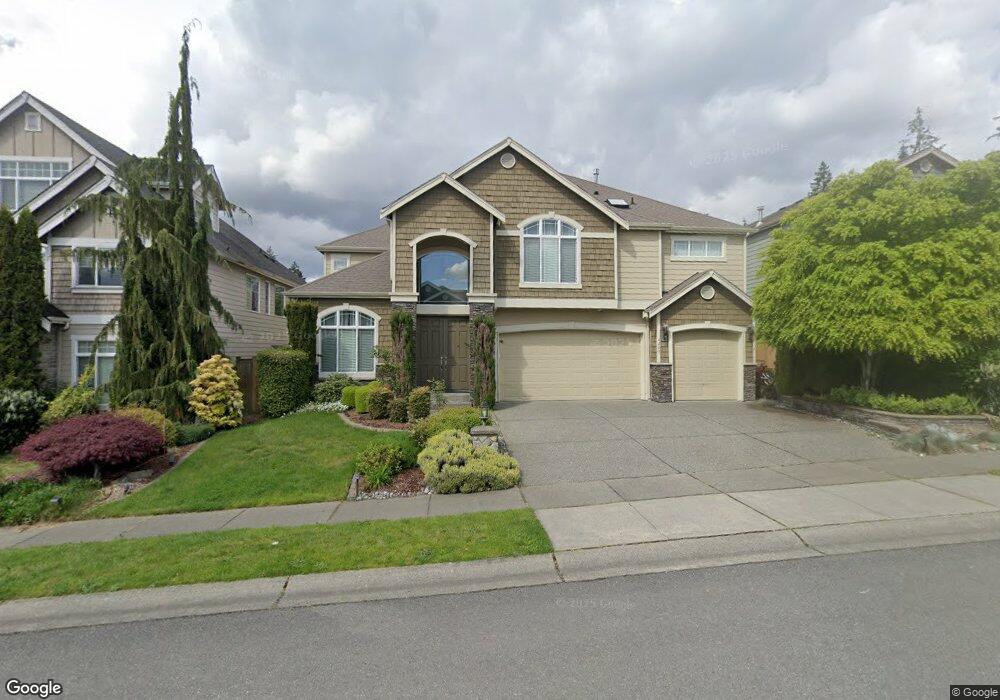
About This Home
This home is located at 4409 216th Place SE, Bothell, WA 98021 and is currently estimated at $1,542,556, approximately $487 per square foot. 4409 216th Place SE is a home located in Snohomish County with nearby schools including Kokanee Elementary School, Leota Middle School, and North Creek High School.
Ownership History
We collect this data history from publicly available records. To have your information removed, we recommend requesting removal directly through your county’s website.
Purchase Details
Home Financials for this Owner
Home Financials are based on the most recent Mortgage that was taken out on this home.Purchase Details
Home Financials for this Owner
Home Financials are based on the most recent Mortgage that was taken out on this home.Home Values in the Area
Average Home Value in this Area
Purchase History
We collect this data history from publicly available records. To have your information removed, we recommend requesting removal directly through your county’s website.
| Date | Buyer | Sale Price | Title Company |
|---|---|---|---|
| $890,000 | Cw Title | ||
| $658,800 | First American Title Ins Co |
Mortgage History
We collect this data history from publicly available records. To have your information removed, we recommend requesting removal directly through your county’s website.
| Date | Status | Borrower | Loan Amount |
|---|---|---|---|
| Open | $712,000 | ||
| Previous Owner | $175,920 | ||
| Previous Owner | $417,000 |
Tax History
We collect this data history from publicly available records. To have your information removed, we recommend requesting removal directly through your county’s website.
| Year | Tax Paid | Tax Assessment Tax Assessment Total Assessment is a certain percentage of the fair market value that is determined by local assessors to be the total taxable value of land and additions on the property. | Land | Improvement |
|---|---|---|---|---|
| 2026 | $12,160 | $1,513,800 | $860,000 | $653,800 |
| 2025 | $10,900 | $1,361,700 | $725,000 | $636,700 |
| 2024 | $10,900 | $1,220,300 | $635,000 | $585,300 |
| 2023 | $10,740 | $1,340,000 | $735,000 | $605,000 |
| 2022 | $9,773 | $969,600 | $450,000 | $519,600 |
| 2020 | $9,264 | $867,700 | $403,000 | $464,700 |
| 2019 | $8,477 | $803,400 | $320,000 | $483,400 |
| 2018 | $8,059 | $711,300 | $280,000 | $431,300 |
| 2017 | $7,019 | $630,600 | $225,000 | $405,600 |
| 2016 | $6,768 | $593,600 | $205,000 | $388,600 |
| 2015 | $6,829 | $569,300 | $191,000 | $378,300 |
| 2013 | $5,707 | $422,800 | $157,000 | $265,800 |
Map
- 21417 43rd Dr SE
- 21927 44th Dr SE
- 21927 45th Ave SE
- 4219 220th St SE
- 4103 220th St SE
- 4118 220th Place SE
- 21023 46th Ave SE
- 3931 221st Place SE
- 3932 221st Place SE
- 4109 223rd Place SE
- 22222 49th Ave SE
- 21923 37th Ave SE
- 4211 208th Place SE
- 22313 38th Ave SE
- 3516 220th St SE
- 3510 220th St SE
- 3348 218th St SE
- 22624 43rd Dr SE
- 22623 42nd Dr SE
- 22724 41st Dr SE
- 4415 216th Place SE
- 4412 215th Place SE Unit CT 20
- 4421 216th Place SE
- 4416 215th Place SE Unit CT 21
- 4410 215th Place SE Unit CT19
- 4404 215th Place SE Unit CT17
- 4418 215th Place SE Unit CT 22
- 4418 215th Place SE
- 4412 215th Place SE
- 4422 215th Place SE Unit CT 23
- 4406 215th Place SE Unit 18
- 4429 216th Place SE
- 4408 216th Place SE
- 4424 215th Place SE Unit CT 24
- 21518 45th Ave SE
- 4414 216th Place SE
- 21526 45th Ave SE
- 21506 45th Ave SE
- 4402 216th Place SE
- 21615 43rd Dr SE Unit CT 13
Ask me questions while you tour the home.