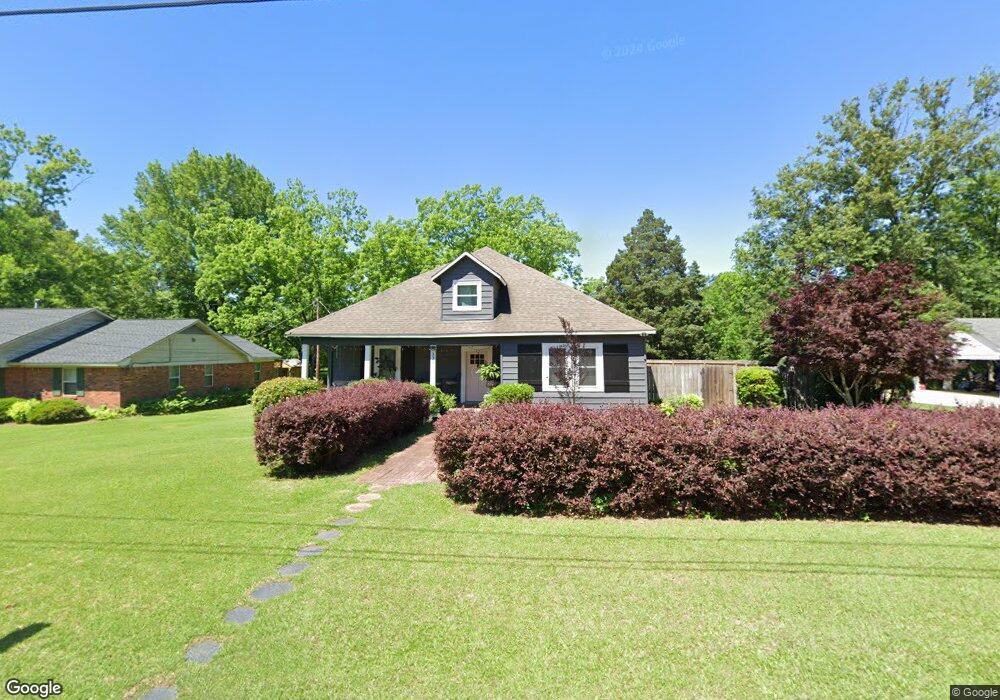
441 Mccord St West Point, MS 39773
Estimated Value: $138,000 - $155,000
2
Beds
--
Bath
2,238
Sq Ft
$67/Sq Ft
Est. Value
About This Home
This home is located at 441 Mccord St, West Point, MS 39773 and is currently estimated at $148,993, approximately $66 per square foot. 441 Mccord St is a home located in Clay County with nearby schools including East Side Elementary School, West Clay Elementary School, and Church Hill Elementary School.
Ownership History
Date
Name
Owned For
Owner Type
Purchase Details
Closed on
Jun 22, 2018
Sold by
Vandiver Richard A
Bought by
Hall Amanda V
Current Estimated Value
Home Financials for this Owner
Home Financials are based on the most recent Mortgage that was taken out on this home.
Original Mortgage
$85,000
Outstanding Balance
$73,675
Interest Rate
4.6%
Mortgage Type
FHA
Estimated Equity
$75,318
Purchase Details
Closed on
Mar 17, 2009
Sold by
National Residential Nominee Sevices In
Bought by
Lindsay Abel David and Lindsay Abel
Home Financials for this Owner
Home Financials are based on the most recent Mortgage that was taken out on this home.
Original Mortgage
$105,102
Interest Rate
5.29%
Create a Home Valuation Report for This Property
The Home Valuation Report is an in-depth analysis detailing your home's value as well as a comparison with similar homes in the area
Home Values in the Area
Average Home Value in this Area
Purchase History
| Date | Buyer | Sale Price | Title Company |
|---|---|---|---|
| Hall Amanda V | -- | -- | |
| Lindsay Abel David | -- | -- |
Source: Public Records
Mortgage History
| Date | Status | Borrower | Loan Amount |
|---|---|---|---|
| Open | Hall Amanda V | $85,000 | |
| Previous Owner | Lindsay Abel David | $105,102 |
Source: Public Records
Tax History Compared to Growth
Tax History
| Year | Tax Paid | Tax Assessment Tax Assessment Total Assessment is a certain percentage of the fair market value that is determined by local assessors to be the total taxable value of land and additions on the property. | Land | Improvement |
|---|---|---|---|---|
| 2024 | $393 | $10,013 | $1,707 | $8,306 |
| 2023 | $974 | $8,509 | $1,707 | $6,802 |
| 2022 | $314 | $8,509 | $1,707 | $6,802 |
| 2021 | $313 | $8,509 | $1,707 | $6,802 |
| 2020 | $312 | $8,509 | $1,707 | $6,802 |
| 2019 | $326 | $9,211 | $1,707 | $7,504 |
| 2018 | $700 | $14,136 | $2,880 | $11,256 |
| 2017 | $700 | $14,136 | $2,880 | $11,256 |
| 2016 | $673 | $14,136 | $2,880 | $11,256 |
| 2015 | $621 | $12,605 | $2,880 | $9,725 |
| 2014 | $199 | $12,605 | $2,880 | $9,725 |
| 2013 | $199 | $12,605 | $2,880 | $9,725 |
Source: Public Records
Map
Nearby Homes
- 1180 E Broad St
- 551 E Westbrook St
- 472 S Eshman Ave
- 1153 E Broad St
- 485 E Westbrook St
- 1104 E Broad St
- 1046 E Brame Ave
- 480 E Westbrook St
- 479 E Westbrook St
- 44 Torbert Dr
- 278 Converse Dr
- 26596 E Main St
- 27045 E Main St
- 329 Converse Dr
- 27445 E Main St
- 238 Calhoun St
- 1124 N Eshman Ave
- 26852 E Main St
- 15 David St
- 26788 E Main St
- 449 Mccord St
- 427 Mccord St
- 419 Mccord St
- 457 Mccord St
- 1043 Rich St
- 424 Mccord St
- 438 Mccord St
- 1066 E Westbrook St
- 1025 Rich St
- 1108 E Westbrook St
- 503 Mccord St
- 742 E Westbrook St
- 1107 E Westbrook St
- 1118 E Westbrook St
- 1045 E Westbrook St
- 1044 Rich St
- 1117 E Westbrook St
- 1015 Rich St
- 519 Mccord St
- 1038 Rich St