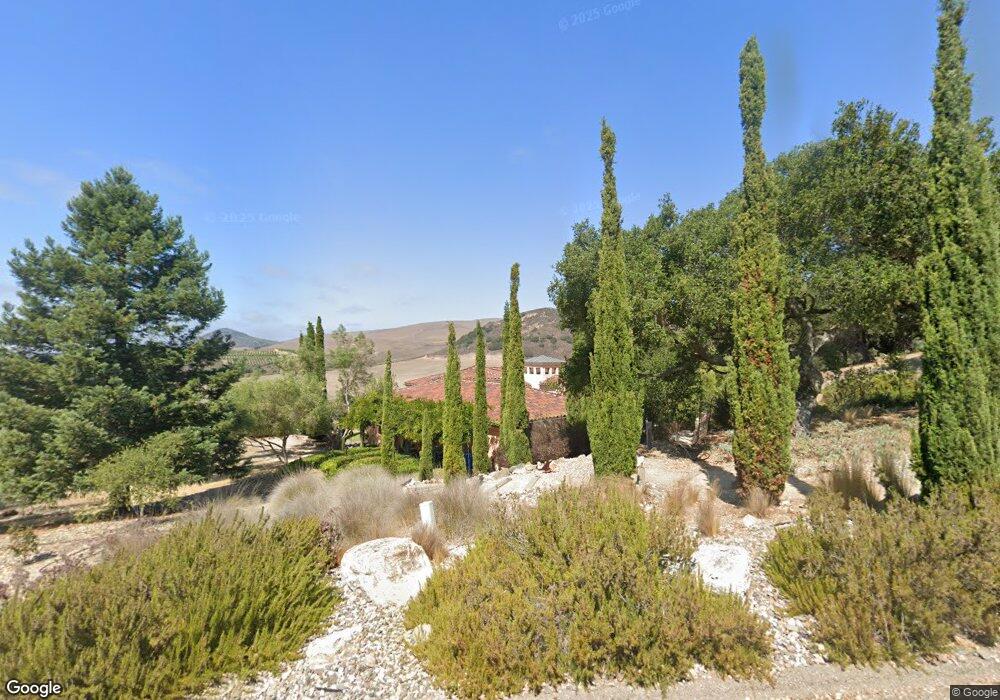
441 Rim Rock Rd Nipomo, CA 93444
Estimated Value: $1,928,007 - $2,635,000
3
Beds
4
Baths
4,129
Sq Ft
$553/Sq Ft
Est. Value
About This Home
This home is located at 441 Rim Rock Rd, Nipomo, CA 93444 and is currently estimated at $2,281,504, approximately $552 per square foot. 441 Rim Rock Rd is a home with nearby schools including Nipomo Elementary School, Mesa Middle School, and Nipomo High School.
Ownership History
Date
Name
Owned For
Owner Type
Purchase Details
Closed on
Apr 12, 2016
Sold by
Stromberg Brent E and Stromberg Mary Beth
Bought by
Stromberg Family Trust
Current Estimated Value
Home Financials for this Owner
Home Financials are based on the most recent Mortgage that was taken out on this home.
Original Mortgage
$544,000
Outstanding Balance
$429,826
Interest Rate
3.68%
Mortgage Type
New Conventional
Estimated Equity
$1,851,678
Purchase Details
Closed on
May 29, 2015
Sold by
Stromberg Brent E and Stromberg Mary Beth
Bought by
Stromberg Family Trust
Home Financials for this Owner
Home Financials are based on the most recent Mortgage that was taken out on this home.
Original Mortgage
$545,000
Interest Rate
3.62%
Mortgage Type
Adjustable Rate Mortgage/ARM
Purchase Details
Closed on
Sep 24, 2004
Sold by
Stromberg Brent Edwin and Stromberg Mary Beth
Bought by
Stromberg Brent Edwin and Stromberg Mary Beth
Home Financials for this Owner
Home Financials are based on the most recent Mortgage that was taken out on this home.
Original Mortgage
$150,000
Interest Rate
5.76%
Mortgage Type
New Conventional
Purchase Details
Closed on
Jul 7, 2004
Sold by
Stromberg Brent Edwin and Stromberg Mary Beth
Bought by
Stromberg Brent Edwin and Stromberg Mary Beth
Home Financials for this Owner
Home Financials are based on the most recent Mortgage that was taken out on this home.
Original Mortgage
$1,000,000
Outstanding Balance
$483,323
Interest Rate
5.94%
Mortgage Type
New Conventional
Estimated Equity
$1,798,181
Purchase Details
Closed on
Feb 12, 2004
Sold by
Stromberg Brent E and Stromberg Mary Beth
Bought by
Stromberg Brent Edwin and Stromberg Mary Beth
Purchase Details
Closed on
Nov 19, 1998
Sold by
Myr Tese Development Inc
Bought by
Stromberg Brent E and Stromberg Mary Beth
Create a Home Valuation Report for This Property
The Home Valuation Report is an in-depth analysis detailing your home's value as well as a comparison with similar homes in the area
Home Values in the Area
Average Home Value in this Area
Purchase History
| Date | Buyer | Sale Price | Title Company |
|---|---|---|---|
| Stromberg Family Trust | -- | First American Title Company | |
| Stromberg Brent E | -- | First American Title Company | |
| Stromberg Family Trust | -- | Consumers Title Company | |
| Stromberg Brent E | -- | Consumers Title Company | |
| Stromberg Brent Edwin | -- | Fidelity Title Company | |
| Stromberg Brent Edwin | -- | Fidelity Title Company | |
| Stromberg Brent Edwin | -- | Fidelity Title Company | |
| Stromberg Brent Edwin | -- | Fidelity Title Company | |
| Stromberg Brent Edwin | -- | -- | |
| Stromberg Brent E | $210,000 | Chicago Title Co |
Source: Public Records
Mortgage History
| Date | Status | Borrower | Loan Amount |
|---|---|---|---|
| Open | Stromberg Brent E | $544,000 | |
| Closed | Stromberg Brent E | $545,000 | |
| Closed | Stromberg Brent Edwin | $150,000 | |
| Open | Stromberg Brent Edwin | $1,000,000 | |
| Closed | Stromberg Brent Edwin | $120,000 |
Source: Public Records
Tax History Compared to Growth
Tax History
| Year | Tax Paid | Tax Assessment Tax Assessment Total Assessment is a certain percentage of the fair market value that is determined by local assessors to be the total taxable value of land and additions on the property. | Land | Improvement |
|---|---|---|---|---|
| 2025 | $11,136 | $1,082,621 | $356,209 | $726,412 |
| 2024 | $11,008 | $1,061,394 | $349,225 | $712,169 |
| 2023 | $11,008 | $1,040,583 | $342,378 | $698,205 |
| 2022 | $10,842 | $1,020,180 | $335,665 | $684,515 |
| 2021 | $10,822 | $1,000,178 | $329,084 | $671,094 |
| 2020 | $10,698 | $989,923 | $325,710 | $664,213 |
| 2019 | $10,633 | $970,514 | $319,324 | $651,190 |
| 2018 | $10,506 | $951,485 | $313,063 | $638,422 |
| 2017 | $10,310 | $932,829 | $306,925 | $625,904 |
| 2016 | $9,723 | $914,539 | $300,907 | $613,632 |
| 2015 | $9,584 | $900,803 | $296,388 | $604,415 |
| 2014 | $9,228 | $883,159 | $290,583 | $592,576 |
Source: Public Records
Map
Nearby Homes
- 225 Broken Arrow Rd
- 1680 Los Berros Rd
- 1276 Pomeroy Rd
- 230 Hans Place
- 462 Camino Perillo
- 1012 Upper Los Berros Rd
- 1150 Redberry Place
- 1790 Calle Laguna
- 639 Barberry Way
- 117 W El Campo Rd
- 1010 1012 Upper Los Berros Rd
- 400 N Oakglen Ave
- 255 Encino Ln
- 940 Calle Fresa
- 150 E Chestnut St
- 285 E Tefft St
- 228 Chaparral Ln
- 1 W Branch St
- 1060 Dawn Rd
- 189 E Tefft St
- 445 Rim Rock Rd
- 1325 N Dana Foothill Rd
- 460 Rim Rock Rd
- 405 Broken Arrow Rd
- 464 Rim Rock Rd
- 438 Rim Rock Rd
- 1361 N Dana Foothill Rd
- 439 Rim Rock Rd
- 428 Rim Rock Rd
- 1330 N Dana Foothill Rd
- 1275 Whispering Meadow Ln
- 1275 Whispering Meadow Ln
- 377 Broken Arrow Rd
- 456 Rim Rock Rd
- 480 Rim Rock Rd
- 340 Broken Arrow Rd
- 1270 N Dana Foothill Rd
- 435 Rim Rock Rd
- 590 La Tapadera Ln