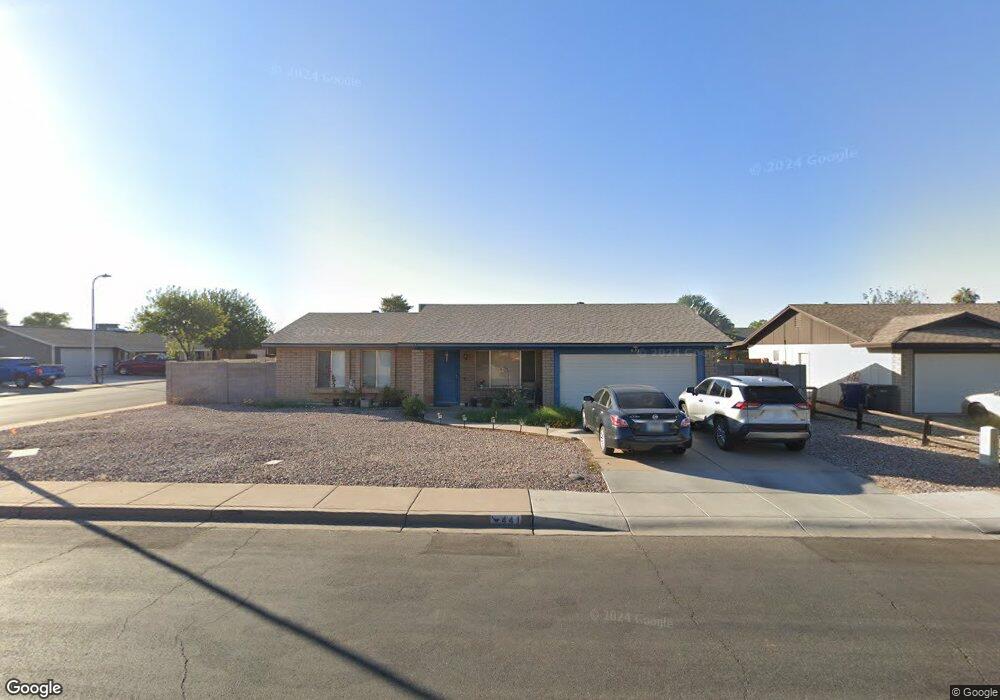
441 W Ranch Rd Chandler, AZ 85225
North Chandler NeighborhoodEstimated Value: $324,254 - $388,000
--
Bed
2
Baths
1,024
Sq Ft
$355/Sq Ft
Est. Value
About This Home
This home is located at 441 W Ranch Rd, Chandler, AZ 85225 and is currently estimated at $363,314, approximately $354 per square foot. 441 W Ranch Rd is a home located in Maricopa County with nearby schools including Sanborn Elementary School, Chandler High School, and Andersen Junior High School.
Ownership History
Date
Name
Owned For
Owner Type
Purchase Details
Closed on
Jun 22, 2023
Sold by
Charbonneau Oneyda
Bought by
Oneyda Charbonneau Trust
Current Estimated Value
Purchase Details
Closed on
Oct 24, 2005
Sold by
Charbonneau Harry A
Bought by
Charbonneau Harry A and Charbonneau Oneyda
Home Financials for this Owner
Home Financials are based on the most recent Mortgage that was taken out on this home.
Original Mortgage
$168,000
Interest Rate
5.68%
Mortgage Type
New Conventional
Purchase Details
Closed on
Mar 1, 2004
Sold by
Chaebonneau Oneyda
Bought by
Charbonneau Harry A
Home Financials for this Owner
Home Financials are based on the most recent Mortgage that was taken out on this home.
Original Mortgage
$25,800
Interest Rate
5.65%
Mortgage Type
Stand Alone Second
Purchase Details
Closed on
Dec 7, 1995
Sold by
Arnold Anthony L and Arnold Mary T
Bought by
Warren Dana S
Create a Home Valuation Report for This Property
The Home Valuation Report is an in-depth analysis detailing your home's value as well as a comparison with similar homes in the area
Home Values in the Area
Average Home Value in this Area
Purchase History
| Date | Buyer | Sale Price | Title Company |
|---|---|---|---|
| Oneyda Charbonneau Trust | -- | None Listed On Document | |
| Charbonneau Harry A | -- | -- | |
| Charbonneau Harry A | -- | -- | |
| Charbonneau Harry A | $129,000 | -- | |
| Warren Dana S | $71,721 | United Title Agency |
Source: Public Records
Mortgage History
| Date | Status | Borrower | Loan Amount |
|---|---|---|---|
| Previous Owner | Charbonneau Harry A | $168,000 | |
| Previous Owner | Charbonneau Harry A | $25,800 | |
| Previous Owner | Charbonneau Harry A | $103,200 |
Source: Public Records
Tax History Compared to Growth
Tax History
| Year | Tax Paid | Tax Assessment Tax Assessment Total Assessment is a certain percentage of the fair market value that is determined by local assessors to be the total taxable value of land and additions on the property. | Land | Improvement |
|---|---|---|---|---|
| 2025 | $950 | $12,191 | -- | -- |
| 2024 | $917 | $11,611 | -- | -- |
| 2023 | $917 | $28,070 | $5,610 | $22,460 |
| 2022 | $885 | $20,730 | $4,140 | $16,590 |
| 2021 | $928 | $19,160 | $3,830 | $15,330 |
| 2020 | $923 | $17,120 | $3,420 | $13,700 |
| 2019 | $888 | $15,560 | $3,110 | $12,450 |
| 2018 | $860 | $13,880 | $2,770 | $11,110 |
| 2017 | $802 | $12,700 | $2,540 | $10,160 |
| 2016 | $772 | $11,580 | $2,310 | $9,270 |
| 2015 | $748 | $10,370 | $2,070 | $8,300 |
Source: Public Records
Map
Nearby Homes
- 1961 N Hartford St Unit 1055
- 1961 N Hartford St Unit 1178
- 1961 N Hartford St Unit 1092
- 1340 N Oregon St
- 1955 N Illinois St
- 1970 N Hartford St Unit 84
- 1970 N Hartford St Unit 88
- 200 E Knox Rd Unit 104
- 200 E Knox Rd Unit 67
- 200 E Knox Rd Unit 145
- 1520 N Hartford St
- 1419 N Vine St
- 440 W Ironwood Dr
- 555 W Warner Rd Unit 127
- 555 W Warner Rd Unit 139
- 555 W Warner Rd Unit 156
- 1255 N Arizona Ave Unit 1289
- 1255 N Arizona Ave Unit 1197
- 1255 N Arizona Ave Unit 1248
- 1255 N Arizona Ave Unit 1323
- 441 N Ranch Rd
- 451 W Ranch Rd
- 458 W Highland St
- 464 W Highland St
- 423 W Highland St
- 461 W Ranch Rd
- 429 W Highland St
- 442 W Ranch Rd
- 422 W Ranch Rd
- 470 W Highland St
- 462 W Ranch Rd
- 394 W Ranch Rd
- 435 W Highland St
- 471 W Ranch Rd Unit III
- 476 W Highland St
- 1832 N Dakota St
- 472 W Ranch Rd
- 384 W Ranch Rd
- 1828 N Dakota St
- 453 W Highland St Unit 3