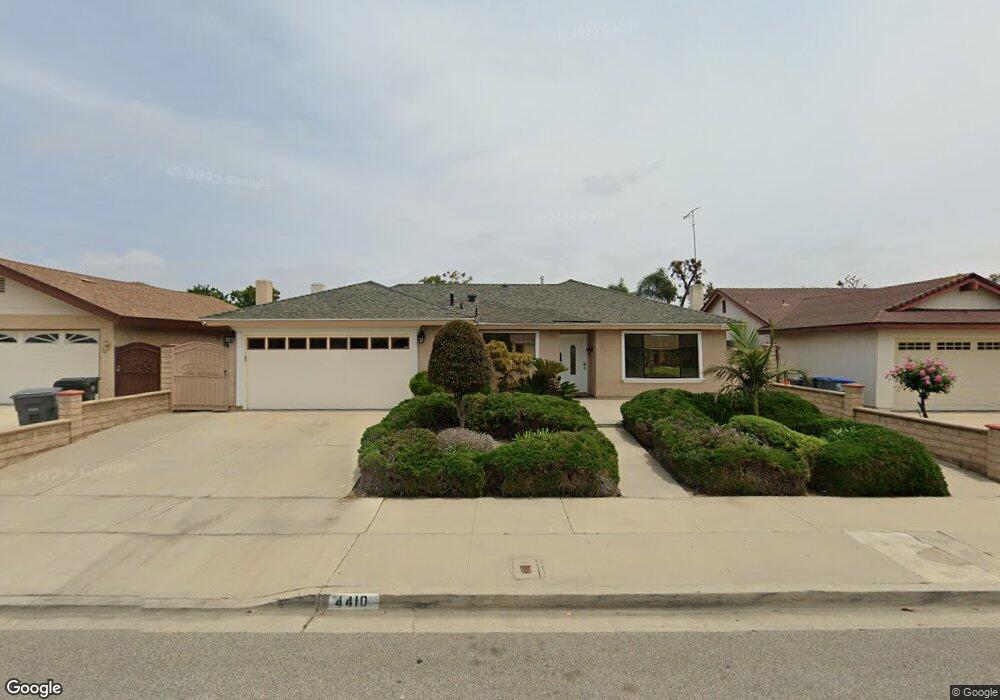
4410 Concord Way Oxnard, CA 93033
Terrace Estates NeighborhoodEstimated Value: $705,522 - $754,000
4
Beds
2
Baths
1,587
Sq Ft
$462/Sq Ft
Est. Value
About This Home
This home is located at 4410 Concord Way, Oxnard, CA 93033 and is currently estimated at $733,131, approximately $461 per square foot. 4410 Concord Way is a home located in Ventura County with nearby schools including Fred L. Williams Elementary School and Channel Islands High School.
Ownership History
Date
Name
Owned For
Owner Type
Purchase Details
Closed on
Apr 12, 2003
Sold by
Capili Joey Abellera and Capili Aida Roque
Bought by
Capili Joey A and Capili Aida R
Current Estimated Value
Purchase Details
Closed on
Dec 3, 2002
Sold by
Capili Joey Abellera and Capili Aida Roque
Bought by
Capili Joey Abellera and Capili Aida Roque
Purchase Details
Closed on
Nov 2, 1993
Sold by
Fletcher Bobbie D and Fletcher Kazuyo N
Bought by
Capili Joey Avellera and Capili Aida Roque
Home Financials for this Owner
Home Financials are based on the most recent Mortgage that was taken out on this home.
Original Mortgage
$178,500
Interest Rate
6.74%
Mortgage Type
Assumption
Create a Home Valuation Report for This Property
The Home Valuation Report is an in-depth analysis detailing your home's value as well as a comparison with similar homes in the area
Home Values in the Area
Average Home Value in this Area
Purchase History
| Date | Buyer | Sale Price | Title Company |
|---|---|---|---|
| Capili Joey A | -- | -- | |
| Capili Joey Abellera | -- | Stewart Title Company | |
| Capili Joey Avellera | $175,000 | First American Title Ins Co |
Source: Public Records
Mortgage History
| Date | Status | Borrower | Loan Amount |
|---|---|---|---|
| Closed | Capili Joey Avellera | $178,500 |
Source: Public Records
Tax History Compared to Growth
Tax History
| Year | Tax Paid | Tax Assessment Tax Assessment Total Assessment is a certain percentage of the fair market value that is determined by local assessors to be the total taxable value of land and additions on the property. | Land | Improvement |
|---|---|---|---|---|
| 2025 | $3,488 | $297,382 | $118,945 | $178,437 |
| 2024 | $3,488 | $291,551 | $116,612 | $174,939 |
| 2023 | $3,282 | $285,835 | $114,326 | $171,509 |
| 2022 | $3,213 | $280,231 | $112,084 | $168,147 |
| 2021 | $3,251 | $274,737 | $109,887 | $164,850 |
| 2020 | $3,310 | $271,921 | $108,761 | $163,160 |
| 2019 | $3,209 | $266,590 | $106,629 | $159,961 |
| 2018 | $3,090 | $261,364 | $104,539 | $156,825 |
| 2017 | $2,989 | $256,240 | $102,490 | $153,750 |
| 2016 | $2,846 | $251,217 | $100,481 | $150,736 |
| 2015 | $2,888 | $247,446 | $98,973 | $148,473 |
| 2014 | $2,835 | $242,600 | $97,035 | $145,565 |
Source: Public Records
Map
Nearby Homes
- 1630 Nelson Place
- 1960 Peoria Place
- 3630 Dallas Dr
- 840 Morro Way
- 5222 Longfellow Way
- 2136 Thrush Ave Unit 2136
- 2143 Cardinal Ave Unit 2143
- 4061 Canary Ln Unit 4061
- 4160 Petit Dr Unit 39
- 1645 Lime Ave Unit 91
- 445 Gaviota Place Unit 124
- 234 Johnson Rd
- 360 Ibsen Place Unit 129
- 300 Ibsen Place Unit 132
- 5170 Edgar St
- 2374 Nash Ln
- 1928 San Benito St
- 0 Oxnard Blvd Unit 25590841
- 2400 E Pleasant Valley Rd Unit 108
- 5225 Columbus Place
- 4420 Concord Way
- 4400 Concord Way
- 4401 Dallas Dr
- 4430 Concord Way
- 4411 Concord Way
- 4401-4601 Dallas Dr
- 4401 Concord Way
- 4421 Concord Way
- 4440 Concord Way
- 4431 Concord Way
- 1611 Billings St
- 1601 Billings St
- 1621 Billings St
- 1531 Billings St
- 4500 Concord Way
- 4441 Concord Way
- 4410 Boston Way
- 1631 Billings St
- 1521 Billings St
- 4400 Boston Way