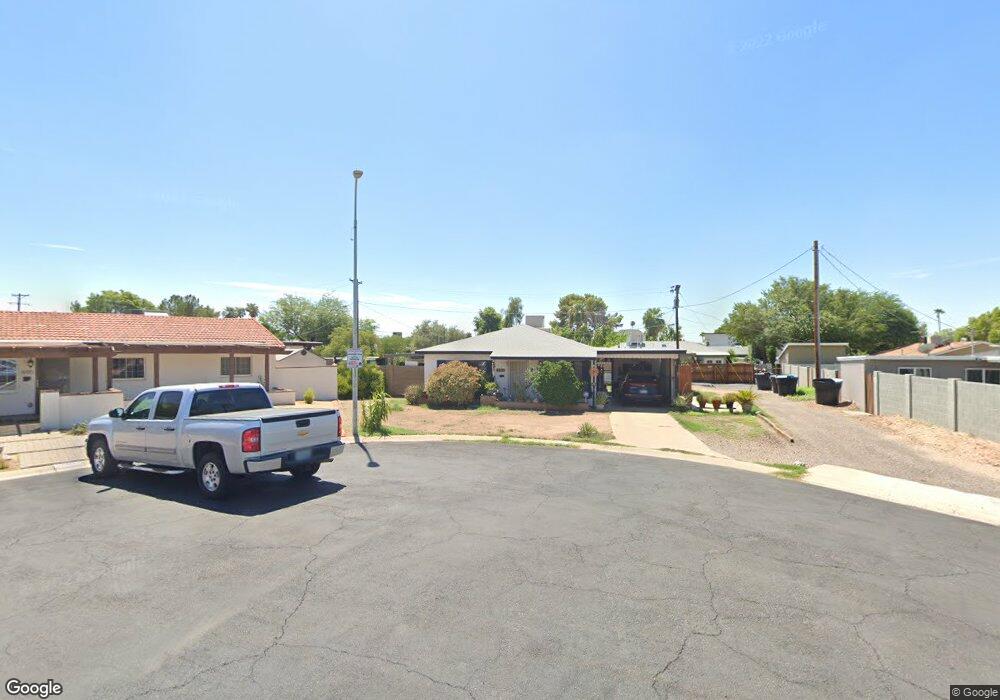
4411 E Sells Dr Phoenix, AZ 85018
Camelback East Village NeighborhoodEstimated Value: $542,433 - $769,000
Studio
1
Bath
952
Sq Ft
$700/Sq Ft
Est. Value
About This Home
This home is located at 4411 E Sells Dr, Phoenix, AZ 85018 and is currently estimated at $666,358, approximately $699 per square foot. 4411 E Sells Dr is a home located in Maricopa County with nearby schools including Hopi Elementary School, Ingleside Middle School, and Arcadia High School.
Ownership History
Date
Name
Owned For
Owner Type
Purchase Details
Closed on
Nov 9, 2016
Sold by
Giuntoli Michael E and Giuntoli Lisa M
Bought by
Giuntoli Michael E and Richardson Ryan S
Current Estimated Value
Home Financials for this Owner
Home Financials are based on the most recent Mortgage that was taken out on this home.
Original Mortgage
$165,000
Outstanding Balance
$132,466
Interest Rate
3.42%
Mortgage Type
New Conventional
Estimated Equity
$533,892
Purchase Details
Closed on
May 13, 2009
Sold by
Estate Of Nancy E Giuntoli and Giuntoli Lisa M
Bought by
Giuntoli Michael E and Giuntoli Lisa M
Create a Home Valuation Report for This Property
The Home Valuation Report is an in-depth analysis detailing your home's value as well as a comparison with similar homes in the area
Home Values in the Area
Average Home Value in this Area
Purchase History
| Date | Buyer | Sale Price | Title Company |
|---|---|---|---|
| Giuntoli Michael E | -- | Equity Title Agency Inc | |
| Giuntoli Michael E | -- | None Available |
Source: Public Records
Mortgage History
| Date | Status | Borrower | Loan Amount |
|---|---|---|---|
| Open | Giuntoli Michael E | $165,000 |
Source: Public Records
Tax History
| Year | Tax Paid | Tax Assessment Tax Assessment Total Assessment is a certain percentage of the fair market value that is determined by local assessors to be the total taxable value of land and additions on the property. | Land | Improvement |
|---|---|---|---|---|
| 2025 | $1,525 | $21,448 | -- | -- |
| 2024 | $1,414 | $20,426 | -- | -- |
| 2023 | $1,414 | $39,980 | $7,990 | $31,990 |
| 2022 | $1,363 | $30,870 | $6,170 | $24,700 |
| 2021 | $1,432 | $27,370 | $5,470 | $21,900 |
| 2020 | $1,409 | $25,430 | $5,080 | $20,350 |
| 2019 | $1,362 | $24,420 | $4,880 | $19,540 |
| 2018 | $1,319 | $22,610 | $4,520 | $18,090 |
| 2017 | $1,251 | $21,300 | $4,260 | $17,040 |
| 2016 | $1,217 | $18,870 | $3,770 | $15,100 |
| 2015 | $1,119 | $16,970 | $3,390 | $13,580 |
Source: Public Records
Map
Nearby Homes
- 4512 E Turney Ave Unit 129
- 4419 N 43rd Place
- 4577 E Calle Ventura
- 4414 E Montecito Ave
- 4402 E Montecito Ave
- 4535 E Campbell Ave
- 4311 E Sells Dr
- 4312 E Roma Ave
- 4596 E Calle Ventura
- 4546 E Campbell Ave
- 4549 E Campbell Ave
- 4610 E Calle Ventura
- 4533 E Montecito Ave
- 4308 E Montecito Ave
- 4435 E Glenrosa Ave
- 4636 E Calle Ventura
- 4227 E Campbell Ave
- 4317 E Glenrosa Ave
- 4242 N 44th St
- 4529 E Glenrosa Ave
- 4408 E Roma Ave
- 4413 N 44th St
- 4414 E Roma Ave
- 4407 N 44th St
- 4415 E Sells Dr
- 4416 E Sells Dr
- 4418 E Roma Ave
- 4401 N 44th St
- 4412 E Sells Dr
- 4412 E Sells Dr Unit 170
- 4422 E Roma Ave
- 4437 E Campbell Ave
- 4441 E Campbell Ave
- 4433 E Campbell Ave
- 4428 E Roma Ave
- 4413 E Roma Ave
- 4408 N 44th St
- 4407 E Roma Ave
- 4447 E Campbell Ave
- 4417 E Roma Ave
Your Personal Tour Guide
Ask me questions while you tour the home.