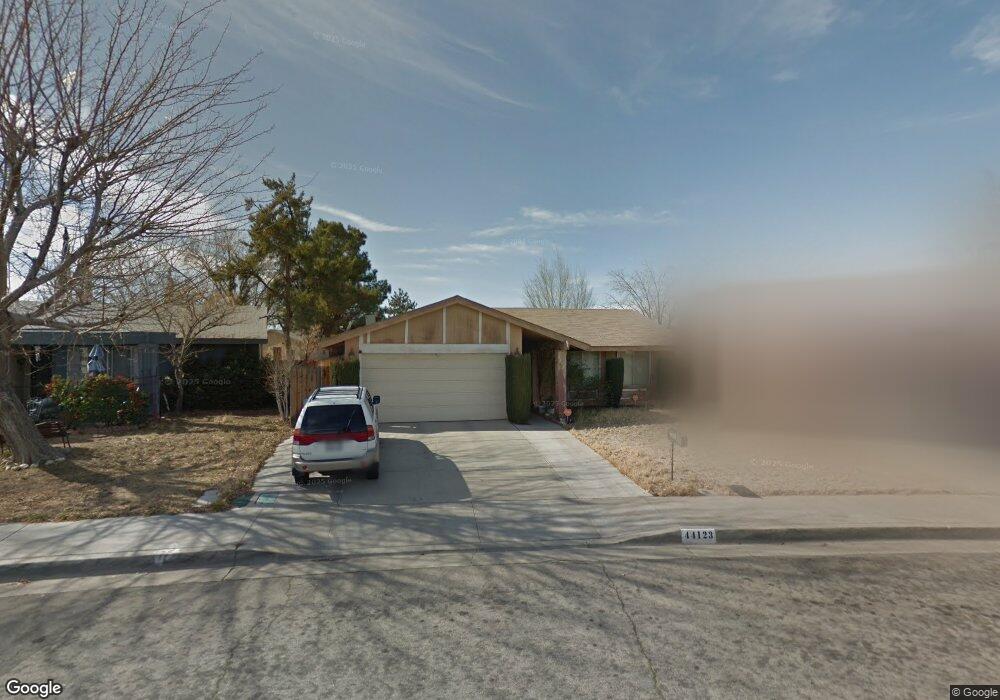
44123 4th St E Lancaster, CA 93535
East Lancaster NeighborhoodEstimated Value: $320,000 - $380,745
3
Beds
2
Baths
1,157
Sq Ft
$310/Sq Ft
Est. Value
About This Home
This home is located at 44123 4th St E, Lancaster, CA 93535 and is currently estimated at $358,436, approximately $309 per square foot. 44123 4th St E is a home located in Los Angeles County with nearby schools including Joshua Elementary, New Vista Middle School, and Antelope Valley High School.
Ownership History
Date
Name
Owned For
Owner Type
Purchase Details
Closed on
Mar 31, 2000
Sold by
Troth Mark and Troth Misty
Bought by
Gatlin Robert and Gatlin Zaida
Current Estimated Value
Home Financials for this Owner
Home Financials are based on the most recent Mortgage that was taken out on this home.
Original Mortgage
$87,600
Outstanding Balance
$30,033
Interest Rate
8.24%
Mortgage Type
VA
Estimated Equity
$328,403
Purchase Details
Closed on
Jan 21, 2000
Sold by
The Bank Of New York
Bought by
Troth Mark and Troth Misty
Purchase Details
Closed on
Jun 24, 1999
Sold by
Lett Leo T and Lett Denise P
Bought by
Bank Of New York
Purchase Details
Closed on
Jun 20, 1994
Sold by
Va
Bought by
Lett Leo T and Lett Denise P
Home Financials for this Owner
Home Financials are based on the most recent Mortgage that was taken out on this home.
Original Mortgage
$80,600
Interest Rate
8.6%
Create a Home Valuation Report for This Property
The Home Valuation Report is an in-depth analysis detailing your home's value as well as a comparison with similar homes in the area
Home Values in the Area
Average Home Value in this Area
Purchase History
| Date | Buyer | Sale Price | Title Company |
|---|---|---|---|
| Gatlin Robert | $85,909 | First American Title Co | |
| Troth Mark | $52,000 | First American | |
| Bank Of New York | $58,565 | -- | |
| Lett Leo T | -- | Fidelity National Title Ins |
Source: Public Records
Mortgage History
| Date | Status | Borrower | Loan Amount |
|---|---|---|---|
| Open | Gatlin Robert | $87,600 | |
| Previous Owner | Lett Leo T | $80,600 |
Source: Public Records
Tax History
| Year | Tax Paid | Tax Assessment Tax Assessment Total Assessment is a certain percentage of the fair market value that is determined by local assessors to be the total taxable value of land and additions on the property. | Land | Improvement |
|---|---|---|---|---|
| 2025 | $2,838 | $132,151 | $26,420 | $105,731 |
| 2024 | $2,838 | $129,560 | $25,902 | $103,658 |
| 2023 | $2,779 | $127,021 | $25,395 | $101,626 |
| 2022 | $2,598 | $124,532 | $24,898 | $99,634 |
| 2021 | $2,221 | $122,091 | $24,410 | $97,681 |
| 2019 | $2,162 | $118,472 | $23,687 | $94,785 |
| 2018 | $2,124 | $116,150 | $23,223 | $92,927 |
| 2016 | $2,019 | $111,641 | $22,322 | $89,319 |
| 2015 | $1,995 | $109,965 | $21,987 | $87,978 |
| 2014 | $1,997 | $107,812 | $21,557 | $86,255 |
Source: Public Records
Map
Nearby Homes
- 44202 4th St E
- 44213 4th St E
- 44034 4th St E
- 44188 Glenraven Rd
- 44101 Kirkland Ave
- 44025 Glenraven Rd
- 44306 3rd St E
- 519 E Avenue J 4
- 43963 Glenraven Rd
- 44309 Gingham Ave
- 44022 Stanridge Ave
- 44325 3rd St E
- 44214 2nd St E
- 44329 3rd St E
- 143 E Avenue j7
- 44125 Rodin Ave
- 47500 5th St E
- 44047 Rodin Ave
- 443 Corona Ct
- 43865 Gingham Ave
- 44117 4th St E
- 44129 4th St E
- 44150 Kirkland Ave
- 44156 Kirkland Ave
- 44113 4th St E
- 44133 4th St E
- 44160 Kirkland Ave
- 44108 Glenraven Rd
- 44100 Glenraven Rd
- 44144 Kirkland Ave
- 44126 4th St E
- 44114 4th St E
- 44107 4th St E
- 44141 4th St E
- 44070 Glenraven Rd
- 44132 4th St E
- 44166 Kirkland Ave
- 44138 Kirkland Ave
- 44064 Glenraven Rd
- 44140 4th St E
Your Personal Tour Guide
Ask me questions while you tour the home.