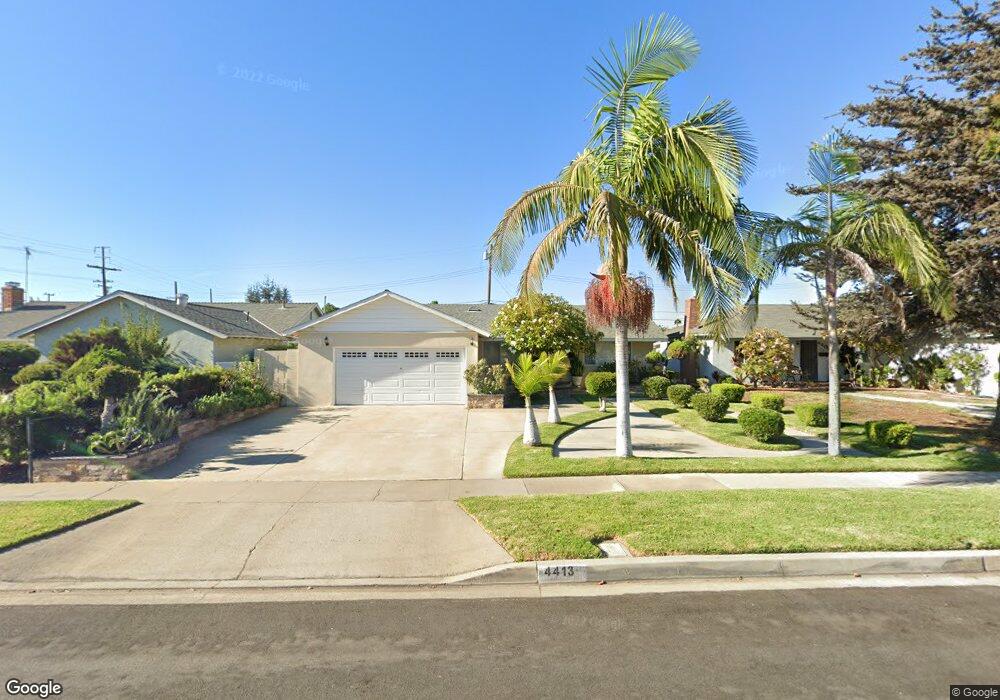
4413 W Maurie Ave Santa Ana, CA 92703
Riverview West NeighborhoodEstimated Value: $984,000 - $1,062,000
3
Beds
2
Baths
1,642
Sq Ft
$620/Sq Ft
Est. Value
About This Home
This home is located at 4413 W Maurie Ave, Santa Ana, CA 92703 and is currently estimated at $1,018,529, approximately $620 per square foot. 4413 W Maurie Ave is a home located in Orange County with nearby schools including R. F. Hazard Elementary School, James Irvine Intermediate School, and Santiago High School.
Ownership History
Date
Name
Owned For
Owner Type
Purchase Details
Closed on
Sep 9, 2020
Sold by
Danny Du Tran Family Revocable Trust and Tran Danny Du
Bought by
Vantran Doan Van and Tran Diana Minh
Current Estimated Value
Purchase Details
Closed on
May 12, 2005
Sold by
Tran Danny Du
Bought by
Tran Danny Du and Danny Du Tran Family Revocable Trust
Purchase Details
Closed on
Jan 9, 2004
Sold by
Tran Danny Du and Tran Du Van
Bought by
Tran Danny Du and Tran Christine Chau
Purchase Details
Closed on
Sep 15, 1998
Sold by
Anh Tran David
Bought by
Tran Danny Du and Tran Du Van
Home Financials for this Owner
Home Financials are based on the most recent Mortgage that was taken out on this home.
Original Mortgage
$132,000
Interest Rate
6.89%
Purchase Details
Closed on
Aug 13, 1998
Sold by
Anh Tran David and Du Danny Du
Bought by
Tran Danny Du
Home Financials for this Owner
Home Financials are based on the most recent Mortgage that was taken out on this home.
Original Mortgage
$132,000
Interest Rate
6.89%
Create a Home Valuation Report for This Property
The Home Valuation Report is an in-depth analysis detailing your home's value as well as a comparison with similar homes in the area
Home Values in the Area
Average Home Value in this Area
Purchase History
| Date | Buyer | Sale Price | Title Company |
|---|---|---|---|
| Vantran Doan Van | -- | None Listed On Document | |
| Tran Danny Du | -- | -- | |
| Tran Danny Du | -- | -- | |
| Tran Danny Du | -- | -- | |
| Tran Danny Du | -- | -- |
Source: Public Records
Mortgage History
| Date | Status | Borrower | Loan Amount |
|---|---|---|---|
| Previous Owner | Tran Danny Du | $132,000 |
Source: Public Records
Tax History Compared to Growth
Tax History
| Year | Tax Paid | Tax Assessment Tax Assessment Total Assessment is a certain percentage of the fair market value that is determined by local assessors to be the total taxable value of land and additions on the property. | Land | Improvement |
|---|---|---|---|---|
| 2025 | $3,607 | $301,891 | $207,766 | $94,125 |
| 2024 | $3,607 | $295,972 | $203,692 | $92,280 |
| 2023 | $3,537 | $290,169 | $199,698 | $90,471 |
| 2022 | $3,455 | $284,480 | $195,782 | $88,698 |
| 2021 | $3,486 | $278,902 | $191,943 | $86,959 |
| 2020 | $3,443 | $276,043 | $189,975 | $86,068 |
| 2019 | $3,400 | $270,631 | $186,250 | $84,381 |
| 2018 | $3,317 | $265,325 | $182,598 | $82,727 |
| 2017 | $3,284 | $260,123 | $179,018 | $81,105 |
| 2016 | $3,143 | $255,023 | $175,508 | $79,515 |
| 2015 | $3,102 | $251,193 | $172,872 | $78,321 |
| 2014 | $3,029 | $246,273 | $169,486 | $76,787 |
Source: Public Records
Map
Nearby Homes
- 1114 N Gates St
- 1609 N Parsons Place
- 526 W Tribella Ct
- 11321 Parkgreen Ln Unit 102
- 4201 W 5th St Unit 314
- 1314 N Bewley St
- 3625 W 11th St
- 4248 W 5th St
- 3929 W 5th St Unit 16
- 13322 Euclid St
- 3932 W 5th St Unit 202
- 10886 Lotus Dr
- 702 N Gunther St
- 4832 W 5th St Unit B
- 230 Green Dr
- 3424 W Washington Ave Unit 228
- 3424 W Washington Ave Unit 309
- 323 N Euclid St Unit 99
- 4518 W 1st St
- 5317 Silver Dr
- 4417 W Maurie Ave
- 4409 W Maurie Ave
- 4405 W Maurie Ave
- 4421 W Maurie Ave
- 4410 Morningside Ave
- 1305 N Newhope St
- 4406 Morningside Ave
- 4401 W Maurie Ave
- 4414 W Maurie Ave
- 4410 W Maurie Ave
- 4418 W Maurie Ave
- 4402 Morningside Ave
- 4414 Morningside Ave
- 4406 W Maurie Ave
- 4422 W Maurie Ave
- 1302 N Mountain View St
- 4325 W Maurie Ave
- 4402 W Maurie Ave
- 4422 Morningside Ave
- 1222 N Newhope St