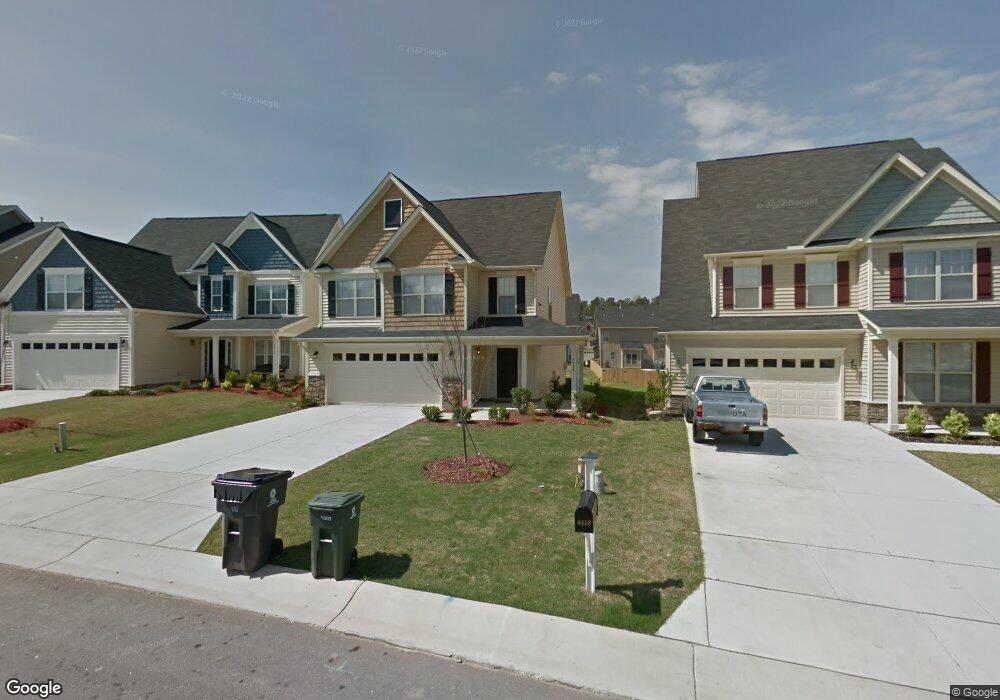
4414 Johnstown Dr Knightdale, NC 27545
Estimated Value: $381,296 - $384,000
4
Beds
3
Baths
1,860
Sq Ft
$206/Sq Ft
Est. Value
About This Home
This home is located at 4414 Johnstown Dr, Knightdale, NC 27545 and is currently estimated at $383,074, approximately $205 per square foot. 4414 Johnstown Dr is a home located in Wake County with nearby schools including Knightdale Elementary School, Neuse River Middle School, and Knightdale High.
Ownership History
Date
Name
Owned For
Owner Type
Purchase Details
Closed on
Jan 27, 2016
Sold by
Mccombs Donna D
Bought by
Rosario Ismelda
Current Estimated Value
Home Financials for this Owner
Home Financials are based on the most recent Mortgage that was taken out on this home.
Original Mortgage
$161,833
Outstanding Balance
$128,674
Interest Rate
3.87%
Mortgage Type
FHA
Estimated Equity
$254,400
Purchase Details
Closed on
Apr 25, 2011
Sold by
Royal Oaks Building Group Llc
Bought by
Mccombs Donna D
Home Financials for this Owner
Home Financials are based on the most recent Mortgage that was taken out on this home.
Original Mortgage
$173,782
Interest Rate
4.74%
Mortgage Type
New Conventional
Purchase Details
Closed on
Dec 14, 2010
Sold by
Churchill Llc
Bought by
Royal Oaks Building Group Llc
Create a Home Valuation Report for This Property
The Home Valuation Report is an in-depth analysis detailing your home's value as well as a comparison with similar homes in the area
Home Values in the Area
Average Home Value in this Area
Purchase History
| Date | Buyer | Sale Price | Title Company |
|---|---|---|---|
| Rosario Ismelda | $183,000 | None Available | |
| Mccombs Donna D | $168,000 | None Available | |
| Royal Oaks Building Group Llc | $42,500 | None Available |
Source: Public Records
Mortgage History
| Date | Status | Borrower | Loan Amount |
|---|---|---|---|
| Open | Rosario Ismelda | $161,833 | |
| Closed | Rosario Ismelda | $161,833 | |
| Previous Owner | Mccombs Donna D | $173,782 |
Source: Public Records
Tax History Compared to Growth
Tax History
| Year | Tax Paid | Tax Assessment Tax Assessment Total Assessment is a certain percentage of the fair market value that is determined by local assessors to be the total taxable value of land and additions on the property. | Land | Improvement |
|---|---|---|---|---|
| 2025 | $3,522 | $365,880 | $70,000 | $295,880 |
| 2024 | $3,509 | $365,880 | $70,000 | $295,880 |
| 2023 | $2,710 | $243,008 | $40,000 | $203,008 |
| 2022 | $2,619 | $243,008 | $40,000 | $203,008 |
| 2021 | $2,499 | $243,008 | $40,000 | $203,008 |
| 2020 | $2,499 | $243,008 | $40,000 | $203,008 |
| 2019 | $2,272 | $195,748 | $40,000 | $155,748 |
| 2018 | $2,143 | $195,748 | $40,000 | $155,748 |
| 2017 | $2,066 | $195,748 | $40,000 | $155,748 |
| 2016 | $2,037 | $195,748 | $40,000 | $155,748 |
| 2015 | $1,974 | $187,042 | $43,000 | $144,042 |
| 2014 | $1,905 | $187,042 | $43,000 | $144,042 |
Source: Public Records
Map
Nearby Homes
- 1209 Agile Dr
- 4809 Smarty Jones Dr
- 2523 Ferdinand Dr
- 2111 Old Rosebud Dr
- 4707 Smarty Jones Dr
- 1006 Trail Stream Way
- 1227 Sunday Silence Dr
- 4013 Twin Spires Dr
- 1308 Plexor Ln
- 114 Montview Way
- 1010 Hadel Place
- 1007 Olde Midway Ct
- 910 Savin Landing
- 1122 Delham Rd
- 603 Calavaras Ln
- 1001 Tarford Place
- 1214 Delham Rd
- 1020 Delta River Way
- 810 Steam Boat St
- 702 Calavaras Ln
- 4412 Johnstown Dr
- 4416 Johnstown Dr
- 4410 Johnstown Dr
- 1103 Kingman Dr
- 1105 Kingman Dr
- 2202 Ferdinand Dr
- 4408 Johnstown Dr
- 1109 Kingman Dr
- 1101 Kingman Dr
- 4409 Johnstown Dr
- 4406 Johnstown Dr
- 1111 Kingman Dr
- 1113 Kingman Dr
- 2109 Ferdinand Dr
- 2204 Ferdinand Dr
- 2107 Ferdinand Dr
- 2201 Ferdinand Dr
- 2105 Ferdinand Dr
- 4407 Johnstown Dr
- 1115 Kingman Dr