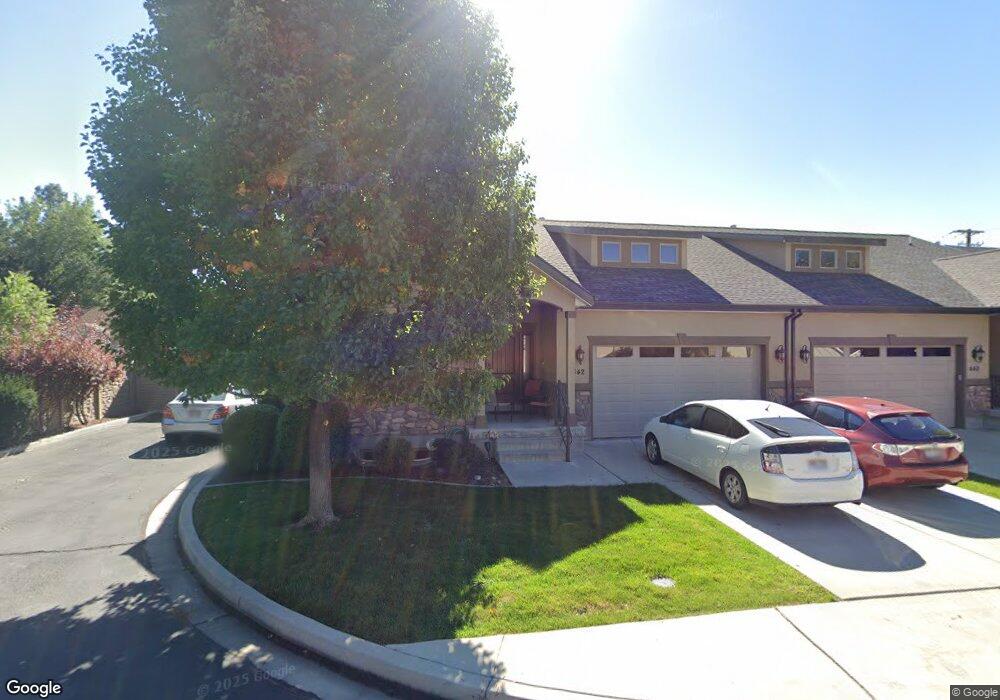
442 E 750 S Orem, UT 84097
SCERA NeighborhoodEstimated Value: $555,357 - $582,000
3
Beds
3
Baths
1,586
Sq Ft
$358/Sq Ft
Est. Value
About This Home
This home is located at 442 E 750 S, Orem, UT 84097 and is currently estimated at $568,119, approximately $358 per square foot. 442 E 750 S is a home located in Utah County with nearby schools including Centennial Elementary, Lakeridge Jr High School, and Orem High School.
Ownership History
Date
Name
Owned For
Owner Type
Purchase Details
Closed on
Mar 12, 2021
Sold by
Herbert Holly
Bought by
Herbert Carter Holly and Calson Susan H
Current Estimated Value
Purchase Details
Closed on
Nov 13, 2012
Sold by
Herbert Gary R
Bought by
Herbert Holly
Home Financials for this Owner
Home Financials are based on the most recent Mortgage that was taken out on this home.
Original Mortgage
$113,500
Interest Rate
3.34%
Mortgage Type
New Conventional
Purchase Details
Closed on
Mar 26, 2010
Sold by
Herbert Holly and Herbert Carol B
Bought by
Herbert Carol B
Purchase Details
Closed on
Jan 5, 2010
Sold by
Herbert Holly
Bought by
Herbert Holly and Herbert Carol B
Home Financials for this Owner
Home Financials are based on the most recent Mortgage that was taken out on this home.
Original Mortgage
$150,000
Interest Rate
4.77%
Mortgage Type
Seller Take Back
Create a Home Valuation Report for This Property
The Home Valuation Report is an in-depth analysis detailing your home's value as well as a comparison with similar homes in the area
Home Values in the Area
Average Home Value in this Area
Purchase History
| Date | Buyer | Sale Price | Title Company |
|---|---|---|---|
| Herbert Carter Holly | -- | None Available | |
| Herbert Holly | -- | Security Title & Abstract | |
| Herbert Carol B | -- | None Available | |
| Herbert Holly | -- | Accommodation | |
| Herbert Holly | -- | Accommodation |
Source: Public Records
Mortgage History
| Date | Status | Borrower | Loan Amount |
|---|---|---|---|
| Closed | Herbert Holly | $113,500 | |
| Closed | Herbert Holly | $150,000 |
Source: Public Records
Tax History
| Year | Tax Paid | Tax Assessment Tax Assessment Total Assessment is a certain percentage of the fair market value that is determined by local assessors to be the total taxable value of land and additions on the property. | Land | Improvement |
|---|---|---|---|---|
| 2025 | $2,611 | $312,675 | -- | -- |
| 2024 | $2,611 | $319,330 | $0 | $0 |
| 2023 | $2,484 | $326,425 | $0 | $0 |
| 2022 | $2,218 | $282,425 | $0 | $0 |
| 2021 | $2,017 | $389,000 | $85,000 | $304,000 |
| 2020 | $1,025 | $381,300 | $85,000 | $296,300 |
| 2019 | $1,756 | $346,000 | $85,000 | $261,000 |
| 2018 | $1,716 | $323,100 | $85,000 | $238,100 |
| 2017 | $1,624 | $163,790 | $0 | $0 |
| 2016 | $1,463 | $136,070 | $0 | $0 |
| 2015 | $1,472 | $129,470 | $0 | $0 |
| 2014 | $1,344 | $117,700 | $0 | $0 |
Source: Public Records
Map
Nearby Homes
Your Personal Tour Guide
Ask me questions while you tour the home.