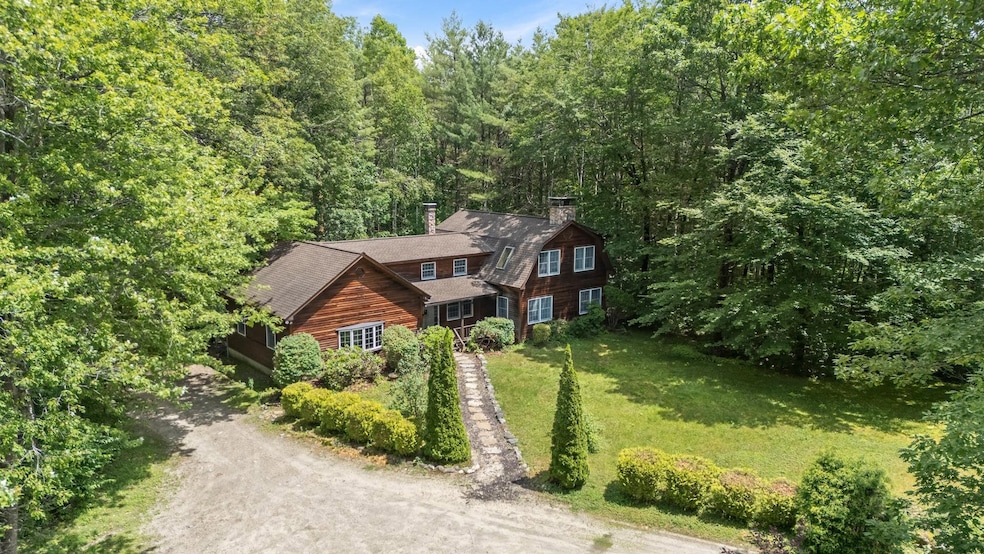

442 Olde Farms Rd Grantham, NH 03753
Estimated payment $4,846/month
Highlights
- 25 Acre Lot
- Deck
- Wooded Lot
- Grantham Village School Rated A
- Contemporary Architecture
- Wood Flooring
About This Home
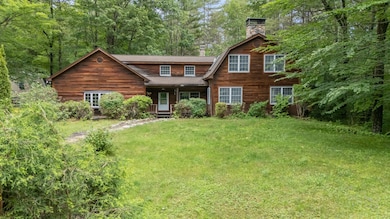
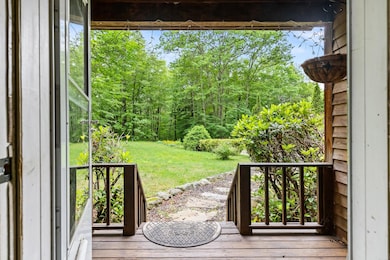
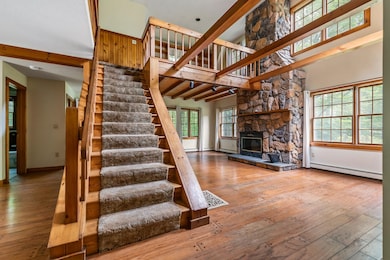
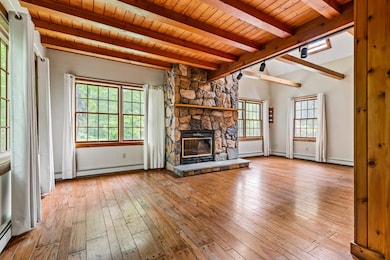
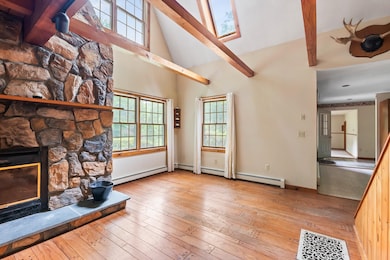
Every day is like a wooded retreat in this home privately situated on 25 acres in the Olde Farms area of Grantham, NH. The true focal point is a gorgeous 2-story stone fireplace in the living area. This 3-bedroom, 2.5-bath home has lots of windows, exposed beams and natural wood accents throughout giving it a cabin-like feel. The formal dining area has beautiful wood floors and opens to the back deck. First-floor primary bedroom with bath, convenient half-bath and family room offering even more living space. The upper level loft with built-in shelving would make a great office space or sitting area. You’ll find 2 more bedrooms and another full bath on the upper level as well. Lower level laundry, storage and unfinished flex space with wood-burning stove. Complete with a detached 2-car garage and landscaped yard with a dog fence, garden space and wooded privacy all around.
Home Details
Home Type
- Single Family
Est. Annual Taxes
- $10,773
Year Built
- Built in 1991
Lot Details
- 25 Acre Lot
- Property fronts a private road
- Wooded Lot
- Garden
- Property is zoned RR2
Parking
- 2 Car Garage
- Stone Driveway
- Gravel Driveway
Home Design
- Contemporary Architecture
- Concrete Foundation
- Wood Frame Construction
- Wood Siding
Interior Spaces
- Property has 2 Levels
- Ceiling Fan
- Fireplace
- Window Screens
- Family Room
- Dining Room
- Basement
- Interior Basement Entry
- Fire and Smoke Detector
Flooring
- Wood
- Carpet
- Tile
- Vinyl
Bedrooms and Bathrooms
- 3 Bedrooms
- Main Floor Bedroom
- En-Suite Bathroom
- Bathroom on Main Level
Laundry
- Dryer
- Washer
Schools
- Grantham Village Elementary School
- Lebanon Middle School
- Lebanon High School
Utilities
- Baseboard Heating
- Hot Water Heating System
- Private Water Source
- Drilled Well
- Septic Tank
- Leach Field
- Phone Available
Additional Features
- Hard or Low Nap Flooring
- Deck
Listing and Financial Details
- Tax Lot 8
- Assessor Parcel Number 217
Map
Home Values in the Area
Average Home Value in this Area
Tax History
| Year | Tax Paid | Tax Assessment Tax Assessment Total Assessment is a certain percentage of the fair market value that is determined by local assessors to be the total taxable value of land and additions on the property. | Land | Improvement |
|---|---|---|---|---|
| 2024 | $10,371 | $528,880 | $71,280 | $457,600 |
| 2023 | $9,302 | $528,800 | $71,200 | $457,600 |
| 2022 | $8,693 | $528,800 | $71,200 | $457,600 |
| 2021 | $8,483 | $370,100 | $75,900 | $294,200 |
| 2020 | $8,682 | $370,060 | $75,860 | $294,200 |
| 2019 | $3,331 | $368,240 | $75,140 | $293,100 |
| 2018 | $5,574 | $368,240 | $75,140 | $293,100 |
| 2017 | $3,023 | $368,160 | $75,060 | $293,100 |
| 2016 | $3,033 | $368,160 | $75,060 | $293,100 |
| 2015 | $8,877 | $368,040 | $74,940 | $293,100 |
| 2014 | $9,051 | $406,440 | $100,640 | $305,800 |
| 2013 | $8,699 | $405,760 | $99,960 | $305,800 |
Property History
| Date | Event | Price | List to Sale | Price per Sq Ft |
|---|---|---|---|---|
| 10/02/2025 10/02/25 | Price Changed | $749,999 | -6.1% | $295 / Sq Ft |
| 08/07/2025 08/07/25 | Price Changed | $799,000 | -8.7% | $314 / Sq Ft |
| 07/10/2025 07/10/25 | For Sale | $875,000 | 0.0% | $344 / Sq Ft |
| 11/15/2021 11/15/21 | Rented | $2,400 | -7.7% | -- |
| 09/27/2021 09/27/21 | For Rent | $2,600 | +30.0% | -- |
| 07/06/2017 07/06/17 | Rented | $2,000 | 0.0% | -- |
| 06/19/2017 06/19/17 | Under Contract | -- | -- | -- |
| 06/06/2017 06/06/17 | For Rent | $2,000 | +11.1% | -- |
| 05/25/2015 05/25/15 | Rented | $1,800 | 0.0% | -- |
| 04/24/2015 04/24/15 | Under Contract | -- | -- | -- |
| 03/11/2015 03/11/15 | For Rent | $1,800 | -- | -- |
Source: PrimeMLS
MLS Number: 5051035
APN: GRNT-000217-000000-000008
Disclaimer: Certain information contained herein is derived from information provided by parties other than Homes.com. All information provided is deemed reliable, but is not guaranteed to be accurate and should be independently verified.
![]() Copyright 2025 PrimeMLS, Inc. All rights reserved. This information is deemed reliable, but not guaranteed. The data relating to real estate displayed on this display comes in part from the IDX Program of PrimeMLS. The information being provided is for consumers’ personal, non-commercial use and may not be used for any purpose other than to identify prospective properties consumers may be interested in purchasing.
Copyright 2025 PrimeMLS, Inc. All rights reserved. This information is deemed reliable, but not guaranteed. The data relating to real estate displayed on this display comes in part from the IDX Program of PrimeMLS. The information being provided is for consumers’ personal, non-commercial use and may not be used for any purpose other than to identify prospective properties consumers may be interested in purchasing.
- 729 Olde Farm Rd
- 351 Miller Pond Rd
- 1284 Route 10 N
- 00 Route 10 N
- 0 Route 10 N Unit 5058175
- 8 Old Spring Dr
- 27 Spring Valley Dr
- 637 Marmot Ln Unit 37
- 23 High Pond Rd
- 49 Old Beach Cir
- 3 Water View
- 6 Anderson Pond Rd
- 38 Terrace View
- 295 Frye Ln
- 8 Sandy Brae
- 64 High Pond Rd
- 16 Summit Dr
- 21 Shore Rd
- 27 Eagle Dr
- 3 Trillium Ln
- 548 Route 10 N Unit B
- 27 Bay Tree Ln Unit A27
- 9 Pioneer Point
- 4 Pioneer Point
- 14 Pioneer Point
- 112 Greensward Dr
- 4 Morning Hollow Ln
- 24 Bright Slope Way
- 11 Sugarwood Ln
- 10 Merrill Place Unit 161
- 41 N Shore Rd
- 7 Wells St
- 7 Wells St
- 6 Paquette Ln
- 43 Piney Point Rd
- 96 Fairway Dr
- 335 Us-4 Unit A
- 25 Mountain View Dr
- 34 Fairway Dr Unit 34
- 75 Bank St
