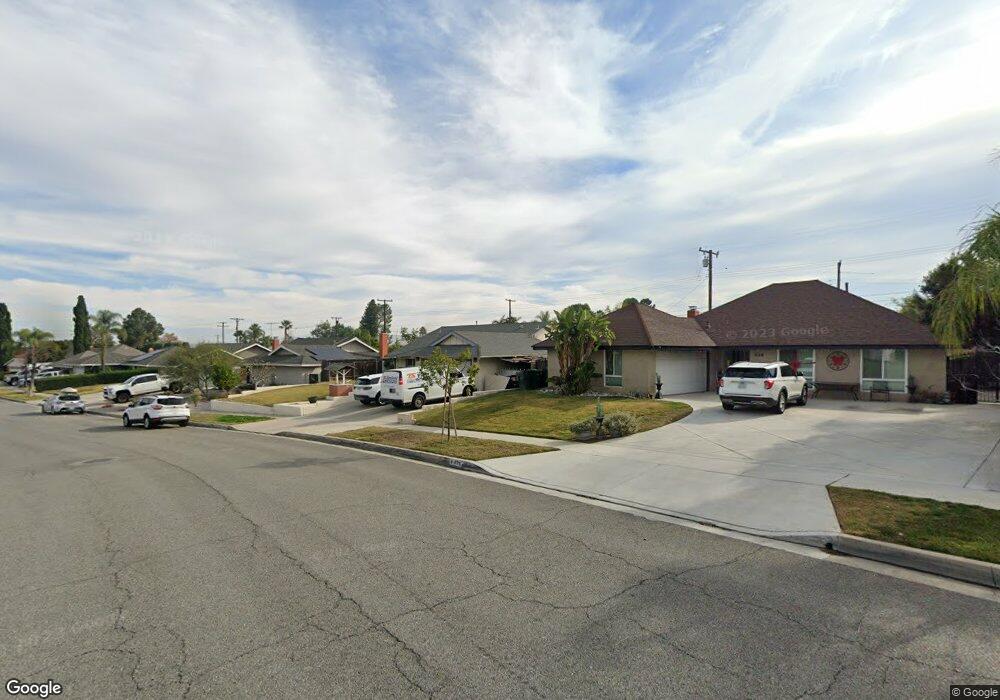
442 Raymor Ave Corona, CA 92879
Central Corona NeighborhoodEstimated Value: $637,867 - $709,000
3
Beds
2
Baths
1,449
Sq Ft
$459/Sq Ft
Est. Value
About This Home
This home is located at 442 Raymor Ave, Corona, CA 92879 and is currently estimated at $665,467, approximately $459 per square foot. 442 Raymor Ave is a home located in Riverside County with nearby schools including Garretson Elementary School, Auburndale Intermediate, and Centennial High School.
Ownership History
Date
Name
Owned For
Owner Type
Purchase Details
Closed on
Feb 10, 2014
Sold by
Smith Barbara M
Bought by
Smith Barbara M
Current Estimated Value
Purchase Details
Closed on
Nov 18, 1997
Sold by
Vilar Anthony G and Vilar Dorian M
Bought by
Smith Bernard and Smith Barbara M
Home Financials for this Owner
Home Financials are based on the most recent Mortgage that was taken out on this home.
Original Mortgage
$130,348
Outstanding Balance
$21,279
Interest Rate
7.22%
Mortgage Type
FHA
Estimated Equity
$644,188
Purchase Details
Closed on
Mar 29, 1994
Sold by
Va
Bought by
Sinks Nancy L
Home Financials for this Owner
Home Financials are based on the most recent Mortgage that was taken out on this home.
Original Mortgage
$116,280
Interest Rate
7.15%
Mortgage Type
Assumption
Purchase Details
Closed on
Mar 2, 1994
Sold by
Dodgen Clifford F and Dodgen Nancy L
Bought by
Vilar Anthony G
Home Financials for this Owner
Home Financials are based on the most recent Mortgage that was taken out on this home.
Original Mortgage
$116,280
Interest Rate
7.15%
Mortgage Type
Assumption
Create a Home Valuation Report for This Property
The Home Valuation Report is an in-depth analysis detailing your home's value as well as a comparison with similar homes in the area
Home Values in the Area
Average Home Value in this Area
Purchase History
| Date | Buyer | Sale Price | Title Company |
|---|---|---|---|
| Smith Barbara M | -- | None Available | |
| Smith Bernard | $131,818 | First American Title Ins Co | |
| Sinks Nancy L | -- | Quality Title | |
| Vilar Anthony G | $114,000 | Quality Title |
Source: Public Records
Mortgage History
| Date | Status | Borrower | Loan Amount |
|---|---|---|---|
| Open | Smith Bernard | $130,348 | |
| Previous Owner | Vilar Anthony G | $116,280 |
Source: Public Records
Tax History
| Year | Tax Paid | Tax Assessment Tax Assessment Total Assessment is a certain percentage of the fair market value that is determined by local assessors to be the total taxable value of land and additions on the property. | Land | Improvement |
|---|---|---|---|---|
| 2025 | $2,261 | $209,134 | $71,832 | $137,302 |
| 2023 | $2,261 | $201,015 | $69,044 | $131,971 |
| 2022 | $2,187 | $197,075 | $67,691 | $129,384 |
| 2021 | $2,142 | $193,212 | $66,364 | $126,848 |
| 2020 | $2,119 | $191,232 | $65,684 | $125,548 |
| 2019 | $2,069 | $187,484 | $64,397 | $123,087 |
| 2018 | $2,022 | $183,809 | $63,135 | $120,674 |
| 2017 | $1,972 | $180,206 | $61,898 | $118,308 |
| 2016 | $1,951 | $176,674 | $60,685 | $115,989 |
| 2015 | $1,908 | $174,022 | $59,774 | $114,248 |
| 2014 | $1,839 | $170,615 | $58,604 | $112,011 |
Source: Public Records
Map
Nearby Homes
- 2102 Beatrice Dr
- 1925 S Starfire Ave
- 1710 Garretson Ave
- 1511 S Main St
- 860 Tangerine St
- 2671 Harvest Crest Ln
- 883 Tangerine St
- 2177 Stratford Dr
- 2885 Citrocado Ranch St
- 1153 E Grand Blvd
- 2690 Mockingbird Ln
- 1740 Forum Way Unit C
- 1761 Forum Way Unit D
- 2476 Grove Ave
- 1185 W Grand Blvd
- 701 W Crestview St
- 2621 Grove Ave
- 938 Ford St
- 970 Riverview Cir
- 945 Ferndale Dr Unit 20
- 434 Raymor Ave
- 450 Raymor Ave
- 426 Raymor Ave
- 458 Raymor Ave
- 438 E Mission Place
- 2124 Beatrice Dr
- 2132 Beatrice Dr
- 431 Raymor Ave
- 2116 Beatrice Dr
- 418 Raymor Ave
- 466 Raymor Ave
- 2140 Beatrice Dr
- 436 E Mission Place
- 421 Raymor Ave
- 461 Raymor Ave
- 2108 Beatrice Dr
- 410 Raymor Ave
- 474 Raymor Ave
- 426 E Mission Place
- 2148 Beatrice Dr
Your Personal Tour Guide
Ask me questions while you tour the home.